Icelander vs Immigrants from Honduras Family Poverty
COMPARE
Icelander
Immigrants from Honduras
Family Poverty
Family Poverty Comparison
Icelanders
Immigrants from Honduras
8.3%
FAMILY POVERTY
90.3/ 100
METRIC RATING
126th/ 347
METRIC RANK
12.7%
FAMILY POVERTY
0.0/ 100
METRIC RATING
322nd/ 347
METRIC RANK
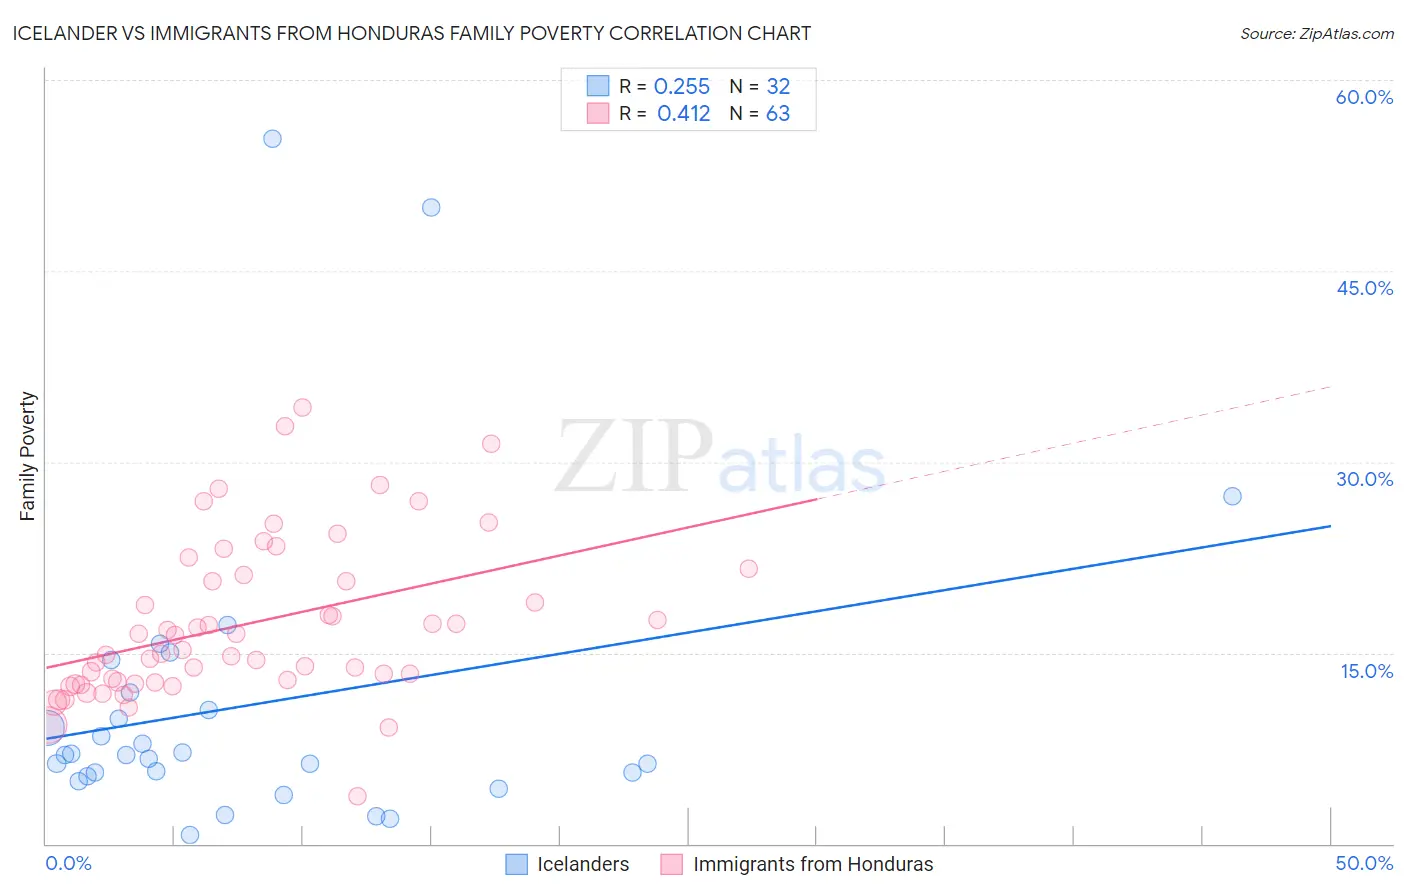
Icelander vs Immigrants from Honduras Family Poverty Correlation Chart
The statistical analysis conducted on geographies consisting of 159,459,929 people shows a weak positive correlation between the proportion of Icelanders and poverty level among families in the United States with a correlation coefficient (R) of 0.255 and weighted average of 8.3%. Similarly, the statistical analysis conducted on geographies consisting of 322,221,893 people shows a moderate positive correlation between the proportion of Immigrants from Honduras and poverty level among families in the United States with a correlation coefficient (R) of 0.412 and weighted average of 12.7%, a difference of 51.7%.
Family Poverty Correlation Summary
| Measurement | Icelander | Immigrants from Honduras |
| Minimum | 0.72% | 3.7% |
| Maximum | 55.4% | 34.3% |
| Range | 54.6% | 30.6% |
| Mean | 10.9% | 17.2% |
| Median | 7.0% | 15.3% |
| Interquartile 25% (IQ1) | 5.4% | 12.7% |
| Interquartile 75% (IQ3) | 11.2% | 21.1% |
| Interquartile Range (IQR) | 5.7% | 8.5% |
| Standard Deviation (Sample) | 12.2% | 6.2% |
| Standard Deviation (Population) | 12.0% | 6.2% |
Similar Demographics by Family Poverty
Demographics Similar to Icelanders by Family Poverty
In terms of family poverty, the demographic groups most similar to Icelanders are Immigrants from Hungary (8.4%, a difference of 0.13%), Pakistani (8.3%, a difference of 0.20%), Soviet Union (8.3%, a difference of 0.24%), Argentinean (8.4%, a difference of 0.27%), and Palestinian (8.3%, a difference of 0.34%).
| Demographics | Rating | Rank | Family Poverty |
| French | 92.8 /100 | #119 | Exceptional 8.3% |
| Immigrants | Egypt | 91.6 /100 | #120 | Exceptional 8.3% |
| Native Hawaiians | 91.3 /100 | #121 | Exceptional 8.3% |
| Paraguayans | 91.2 /100 | #122 | Exceptional 8.3% |
| Palestinians | 91.1 /100 | #123 | Exceptional 8.3% |
| Soviet Union | 90.8 /100 | #124 | Exceptional 8.3% |
| Pakistanis | 90.8 /100 | #125 | Exceptional 8.3% |
| Icelanders | 90.3 /100 | #126 | Exceptional 8.3% |
| Immigrants | Hungary | 89.9 /100 | #127 | Excellent 8.4% |
| Argentineans | 89.6 /100 | #128 | Excellent 8.4% |
| Portuguese | 89.2 /100 | #129 | Excellent 8.4% |
| Immigrants | Bosnia and Herzegovina | 88.6 /100 | #130 | Excellent 8.4% |
| Puget Sound Salish | 88.6 /100 | #131 | Excellent 8.4% |
| Immigrants | Argentina | 88.2 /100 | #132 | Excellent 8.4% |
| Sri Lankans | 86.6 /100 | #133 | Excellent 8.5% |
Demographics Similar to Immigrants from Honduras by Family Poverty
In terms of family poverty, the demographic groups most similar to Immigrants from Honduras are Arapaho (12.7%, a difference of 0.10%), Menominee (12.7%, a difference of 0.54%), Immigrants from Dominica (12.7%, a difference of 0.62%), Inupiat (12.5%, a difference of 1.6%), and British West Indian (12.4%, a difference of 2.1%).
| Demographics | Rating | Rank | Family Poverty |
| Immigrants | Mexico | 0.0 /100 | #315 | Tragic 12.3% |
| Hondurans | 0.0 /100 | #316 | Tragic 12.4% |
| Immigrants | Grenada | 0.0 /100 | #317 | Tragic 12.4% |
| U.S. Virgin Islanders | 0.0 /100 | #318 | Tragic 12.4% |
| British West Indians | 0.0 /100 | #319 | Tragic 12.4% |
| Inupiat | 0.0 /100 | #320 | Tragic 12.5% |
| Arapaho | 0.0 /100 | #321 | Tragic 12.7% |
| Immigrants | Honduras | 0.0 /100 | #322 | Tragic 12.7% |
| Menominee | 0.0 /100 | #323 | Tragic 12.7% |
| Immigrants | Dominica | 0.0 /100 | #324 | Tragic 12.7% |
| Paiute | 0.0 /100 | #325 | Tragic 13.0% |
| Colville | 0.0 /100 | #326 | Tragic 13.0% |
| Yakama | 0.0 /100 | #327 | Tragic 13.1% |
| Central American Indians | 0.0 /100 | #328 | Tragic 13.3% |
| Blacks/African Americans | 0.0 /100 | #329 | Tragic 13.3% |