Hmong vs Immigrants from Turkey Family Poverty
COMPARE
Hmong
Immigrants from Turkey
Family Poverty
Family Poverty Comparison
Hmong
Immigrants from Turkey
9.1%
FAMILY POVERTY
40.2/ 100
METRIC RATING
181st/ 347
METRIC RANK
8.0%
FAMILY POVERTY
96.5/ 100
METRIC RATING
96th/ 347
METRIC RANK
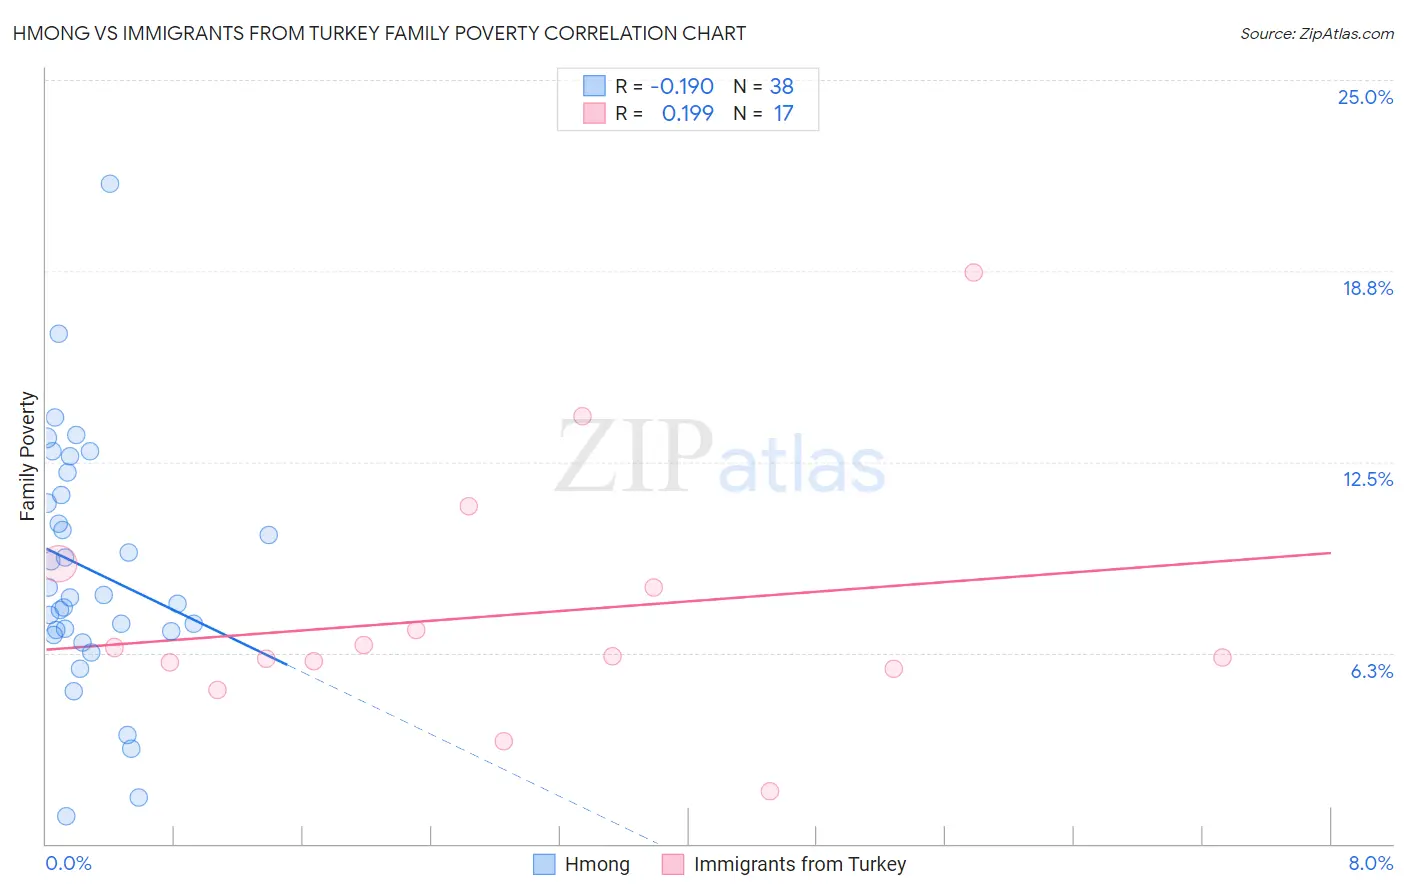
Hmong vs Immigrants from Turkey Family Poverty Correlation Chart
The statistical analysis conducted on geographies consisting of 24,669,739 people shows a poor negative correlation between the proportion of Hmong and poverty level among families in the United States with a correlation coefficient (R) of -0.190 and weighted average of 9.1%. Similarly, the statistical analysis conducted on geographies consisting of 222,589,899 people shows a poor positive correlation between the proportion of Immigrants from Turkey and poverty level among families in the United States with a correlation coefficient (R) of 0.199 and weighted average of 8.0%, a difference of 13.7%.
Family Poverty Correlation Summary
| Measurement | Hmong | Immigrants from Turkey |
| Minimum | 0.91% | 1.7% |
| Maximum | 21.6% | 18.7% |
| Range | 20.7% | 17.0% |
| Mean | 9.0% | 7.5% |
| Median | 8.1% | 6.1% |
| Interquartile 25% (IQ1) | 7.0% | 5.8% |
| Interquartile 75% (IQ3) | 11.4% | 8.8% |
| Interquartile Range (IQR) | 4.5% | 3.0% |
| Standard Deviation (Sample) | 4.1% | 4.0% |
| Standard Deviation (Population) | 4.0% | 3.9% |
Similar Demographics by Family Poverty
Demographics Similar to Hmong by Family Poverty
In terms of family poverty, the demographic groups most similar to Hmong are Immigrants from Morocco (9.1%, a difference of 0.010%), Uruguayan (9.1%, a difference of 0.14%), South American Indian (9.1%, a difference of 0.21%), Immigrants from Saudi Arabia (9.1%, a difference of 0.22%), and Immigrants from Uganda (9.1%, a difference of 0.43%).
| Demographics | Rating | Rank | Family Poverty |
| Immigrants | Albania | 50.0 /100 | #174 | Average 9.0% |
| Costa Ricans | 49.3 /100 | #175 | Average 9.0% |
| Immigrants | Syria | 47.5 /100 | #176 | Average 9.0% |
| Hawaiians | 47.2 /100 | #177 | Average 9.0% |
| Immigrants | Cameroon | 47.1 /100 | #178 | Average 9.0% |
| Immigrants | Iraq | 44.4 /100 | #179 | Average 9.1% |
| Immigrants | Uganda | 43.4 /100 | #180 | Average 9.1% |
| Hmong | 40.2 /100 | #181 | Average 9.1% |
| Immigrants | Morocco | 40.2 /100 | #182 | Average 9.1% |
| Uruguayans | 39.2 /100 | #183 | Fair 9.1% |
| South American Indians | 38.7 /100 | #184 | Fair 9.1% |
| Immigrants | Saudi Arabia | 38.6 /100 | #185 | Fair 9.1% |
| Colombians | 36.1 /100 | #186 | Fair 9.2% |
| Delaware | 35.4 /100 | #187 | Fair 9.2% |
| Immigrants | Kenya | 34.0 /100 | #188 | Fair 9.2% |
Demographics Similar to Immigrants from Turkey by Family Poverty
In terms of family poverty, the demographic groups most similar to Immigrants from Turkey are Immigrants from Philippines (8.0%, a difference of 0.020%), Immigrants from Pakistan (8.0%, a difference of 0.030%), Tlingit-Haida (8.0%, a difference of 0.14%), Czechoslovakian (8.0%, a difference of 0.32%), and Immigrants from Switzerland (8.1%, a difference of 0.41%).
| Demographics | Rating | Rank | Family Poverty |
| Immigrants | Denmark | 97.1 /100 | #89 | Exceptional 8.0% |
| Immigrants | England | 97.1 /100 | #90 | Exceptional 8.0% |
| Immigrants | Italy | 97.0 /100 | #91 | Exceptional 8.0% |
| Czechoslovakians | 96.8 /100 | #92 | Exceptional 8.0% |
| Tlingit-Haida | 96.7 /100 | #93 | Exceptional 8.0% |
| Immigrants | Pakistan | 96.6 /100 | #94 | Exceptional 8.0% |
| Immigrants | Philippines | 96.5 /100 | #95 | Exceptional 8.0% |
| Immigrants | Turkey | 96.5 /100 | #96 | Exceptional 8.0% |
| Immigrants | Switzerland | 96.1 /100 | #97 | Exceptional 8.1% |
| Immigrants | South Africa | 95.9 /100 | #98 | Exceptional 8.1% |
| Welsh | 95.8 /100 | #99 | Exceptional 8.1% |
| New Zealanders | 95.8 /100 | #100 | Exceptional 8.1% |
| Immigrants | Norway | 95.7 /100 | #101 | Exceptional 8.1% |
| Immigrants | Indonesia | 95.7 /100 | #102 | Exceptional 8.1% |
| Immigrants | Eastern Europe | 95.6 /100 | #103 | Exceptional 8.1% |