Hmong vs Immigrants from Caribbean Family Poverty
COMPARE
Hmong
Immigrants from Caribbean
Family Poverty
Family Poverty Comparison
Hmong
Immigrants from Caribbean
9.1%
FAMILY POVERTY
40.2/ 100
METRIC RATING
181st/ 347
METRIC RANK
12.2%
FAMILY POVERTY
0.0/ 100
METRIC RATING
313th/ 347
METRIC RANK
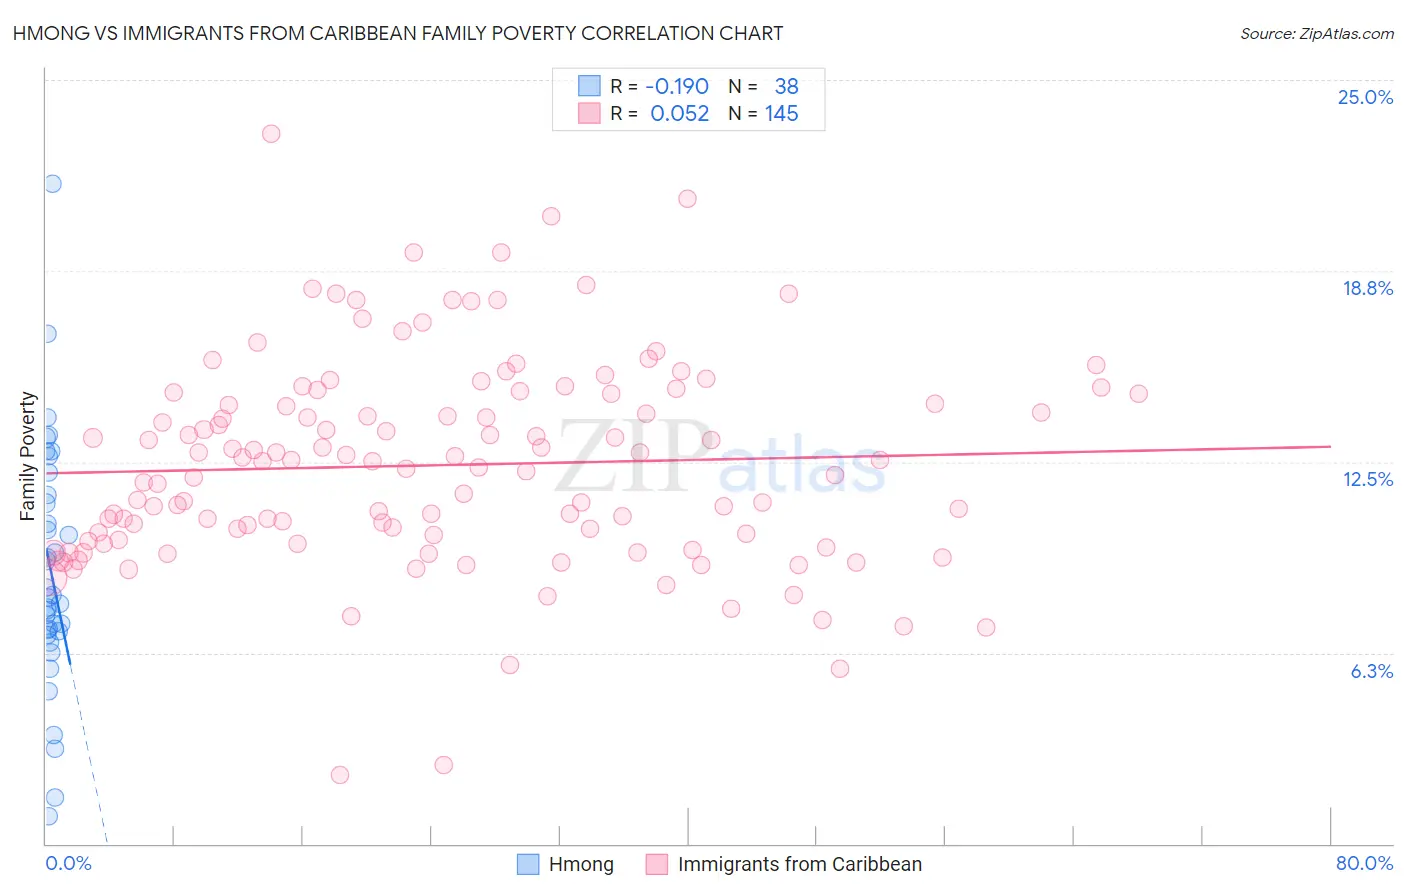
Hmong vs Immigrants from Caribbean Family Poverty Correlation Chart
The statistical analysis conducted on geographies consisting of 24,669,739 people shows a poor negative correlation between the proportion of Hmong and poverty level among families in the United States with a correlation coefficient (R) of -0.190 and weighted average of 9.1%. Similarly, the statistical analysis conducted on geographies consisting of 448,312,225 people shows a slight positive correlation between the proportion of Immigrants from Caribbean and poverty level among families in the United States with a correlation coefficient (R) of 0.052 and weighted average of 12.2%, a difference of 33.6%.
Family Poverty Correlation Summary
| Measurement | Hmong | Immigrants from Caribbean |
| Minimum | 0.91% | 2.2% |
| Maximum | 21.6% | 23.2% |
| Range | 20.7% | 21.0% |
| Mean | 9.0% | 12.4% |
| Median | 8.1% | 12.5% |
| Interquartile 25% (IQ1) | 7.0% | 9.9% |
| Interquartile 75% (IQ3) | 11.4% | 14.7% |
| Interquartile Range (IQR) | 4.5% | 4.8% |
| Standard Deviation (Sample) | 4.1% | 3.4% |
| Standard Deviation (Population) | 4.0% | 3.4% |
Similar Demographics by Family Poverty
Demographics Similar to Hmong by Family Poverty
In terms of family poverty, the demographic groups most similar to Hmong are Immigrants from Morocco (9.1%, a difference of 0.010%), Uruguayan (9.1%, a difference of 0.14%), South American Indian (9.1%, a difference of 0.21%), Immigrants from Saudi Arabia (9.1%, a difference of 0.22%), and Immigrants from Uganda (9.1%, a difference of 0.43%).
| Demographics | Rating | Rank | Family Poverty |
| Immigrants | Albania | 50.0 /100 | #174 | Average 9.0% |
| Costa Ricans | 49.3 /100 | #175 | Average 9.0% |
| Immigrants | Syria | 47.5 /100 | #176 | Average 9.0% |
| Hawaiians | 47.2 /100 | #177 | Average 9.0% |
| Immigrants | Cameroon | 47.1 /100 | #178 | Average 9.0% |
| Immigrants | Iraq | 44.4 /100 | #179 | Average 9.1% |
| Immigrants | Uganda | 43.4 /100 | #180 | Average 9.1% |
| Hmong | 40.2 /100 | #181 | Average 9.1% |
| Immigrants | Morocco | 40.2 /100 | #182 | Average 9.1% |
| Uruguayans | 39.2 /100 | #183 | Fair 9.1% |
| South American Indians | 38.7 /100 | #184 | Fair 9.1% |
| Immigrants | Saudi Arabia | 38.6 /100 | #185 | Fair 9.1% |
| Colombians | 36.1 /100 | #186 | Fair 9.2% |
| Delaware | 35.4 /100 | #187 | Fair 9.2% |
| Immigrants | Kenya | 34.0 /100 | #188 | Fair 9.2% |
Demographics Similar to Immigrants from Caribbean by Family Poverty
In terms of family poverty, the demographic groups most similar to Immigrants from Caribbean are Kiowa (12.2%, a difference of 0.50%), Immigrants from Central America (12.1%, a difference of 0.68%), Immigrants from Mexico (12.3%, a difference of 0.76%), Ute (12.1%, a difference of 1.1%), and Honduran (12.4%, a difference of 1.5%).
| Demographics | Rating | Rank | Family Poverty |
| Cajuns | 0.0 /100 | #306 | Tragic 11.9% |
| Immigrants | Congo | 0.0 /100 | #307 | Tragic 11.9% |
| Seminole | 0.0 /100 | #308 | Tragic 11.9% |
| Hispanics or Latinos | 0.0 /100 | #309 | Tragic 12.0% |
| Immigrants | Guatemala | 0.0 /100 | #310 | Tragic 12.0% |
| Ute | 0.0 /100 | #311 | Tragic 12.1% |
| Immigrants | Central America | 0.0 /100 | #312 | Tragic 12.1% |
| Immigrants | Caribbean | 0.0 /100 | #313 | Tragic 12.2% |
| Kiowa | 0.0 /100 | #314 | Tragic 12.2% |
| Immigrants | Mexico | 0.0 /100 | #315 | Tragic 12.3% |
| Hondurans | 0.0 /100 | #316 | Tragic 12.4% |
| Immigrants | Grenada | 0.0 /100 | #317 | Tragic 12.4% |
| U.S. Virgin Islanders | 0.0 /100 | #318 | Tragic 12.4% |
| British West Indians | 0.0 /100 | #319 | Tragic 12.4% |
| Inupiat | 0.0 /100 | #320 | Tragic 12.5% |