Greek vs Hungarian Family Poverty
COMPARE
Greek
Hungarian
Family Poverty
Family Poverty Comparison
Greeks
Hungarians
7.5%
FAMILY POVERTY
99.4/ 100
METRIC RATING
35th/ 347
METRIC RANK
8.8%
FAMILY POVERTY
67.2/ 100
METRIC RATING
160th/ 347
METRIC RANK
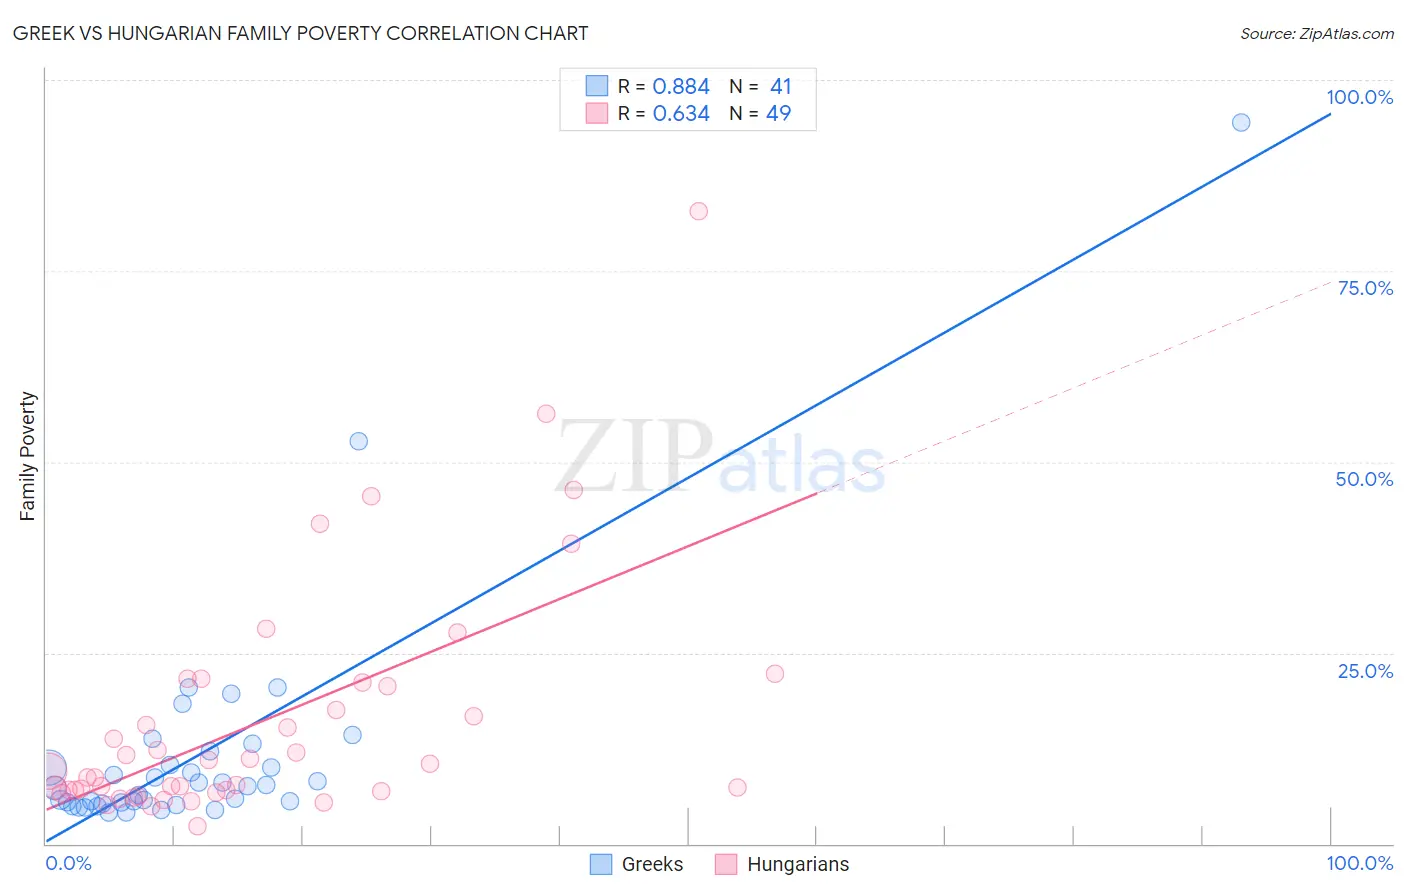
Greek vs Hungarian Family Poverty Correlation Chart
The statistical analysis conducted on geographies consisting of 480,426,664 people shows a very strong positive correlation between the proportion of Greeks and poverty level among families in the United States with a correlation coefficient (R) of 0.884 and weighted average of 7.5%. Similarly, the statistical analysis conducted on geographies consisting of 483,762,053 people shows a significant positive correlation between the proportion of Hungarians and poverty level among families in the United States with a correlation coefficient (R) of 0.634 and weighted average of 8.8%, a difference of 17.2%.
Family Poverty Correlation Summary
| Measurement | Greek | Hungarian |
| Minimum | 4.1% | 2.4% |
| Maximum | 94.4% | 82.8% |
| Range | 90.3% | 80.4% |
| Mean | 11.7% | 16.1% |
| Median | 7.5% | 9.5% |
| Interquartile 25% (IQ1) | 5.3% | 6.9% |
| Interquartile 75% (IQ3) | 11.2% | 20.9% |
| Interquartile Range (IQR) | 5.9% | 13.9% |
| Standard Deviation (Sample) | 15.6% | 15.7% |
| Standard Deviation (Population) | 15.4% | 15.6% |
Similar Demographics by Family Poverty
Demographics Similar to Greeks by Family Poverty
In terms of family poverty, the demographic groups most similar to Greeks are Turkish (7.5%, a difference of 0.010%), Estonian (7.5%, a difference of 0.18%), Bolivian (7.5%, a difference of 0.43%), Carpatho Rusyn (7.5%, a difference of 0.49%), and Slovene (7.5%, a difference of 0.52%).
| Demographics | Rating | Rank | Family Poverty |
| Immigrants | Korea | 99.6 /100 | #28 | Exceptional 7.4% |
| Immigrants | Northern Europe | 99.6 /100 | #29 | Exceptional 7.4% |
| Italians | 99.6 /100 | #30 | Exceptional 7.4% |
| Czechs | 99.6 /100 | #31 | Exceptional 7.4% |
| Poles | 99.5 /100 | #32 | Exceptional 7.4% |
| Immigrants | Japan | 99.5 /100 | #33 | Exceptional 7.4% |
| Russians | 99.5 /100 | #34 | Exceptional 7.5% |
| Greeks | 99.4 /100 | #35 | Exceptional 7.5% |
| Turks | 99.4 /100 | #36 | Exceptional 7.5% |
| Estonians | 99.4 /100 | #37 | Exceptional 7.5% |
| Bolivians | 99.3 /100 | #38 | Exceptional 7.5% |
| Carpatho Rusyns | 99.3 /100 | #39 | Exceptional 7.5% |
| Slovenes | 99.3 /100 | #40 | Exceptional 7.5% |
| Immigrants | Australia | 99.2 /100 | #41 | Exceptional 7.6% |
| Scandinavians | 99.1 /100 | #42 | Exceptional 7.6% |
Demographics Similar to Hungarians by Family Poverty
In terms of family poverty, the demographic groups most similar to Hungarians are Immigrants from Northern Africa (8.8%, a difference of 0.040%), Peruvian (8.8%, a difference of 0.13%), Ethiopian (8.8%, a difference of 0.13%), Pennsylvania German (8.8%, a difference of 0.18%), and White/Caucasian (8.8%, a difference of 0.30%).
| Demographics | Rating | Rank | Family Poverty |
| Immigrants | Spain | 79.1 /100 | #153 | Good 8.6% |
| Immigrants | Vietnam | 75.4 /100 | #154 | Good 8.7% |
| Immigrants | Kuwait | 73.6 /100 | #155 | Good 8.7% |
| Immigrants | Oceania | 71.2 /100 | #156 | Good 8.7% |
| Tsimshian | 69.3 /100 | #157 | Good 8.8% |
| Whites/Caucasians | 69.1 /100 | #158 | Good 8.8% |
| Peruvians | 68.0 /100 | #159 | Good 8.8% |
| Hungarians | 67.2 /100 | #160 | Good 8.8% |
| Immigrants | Northern Africa | 66.9 /100 | #161 | Good 8.8% |
| Ethiopians | 66.3 /100 | #162 | Good 8.8% |
| Pennsylvania Germans | 66.0 /100 | #163 | Good 8.8% |
| Celtics | 64.9 /100 | #164 | Good 8.8% |
| Guamanians/Chamorros | 64.7 /100 | #165 | Good 8.8% |
| Afghans | 63.5 /100 | #166 | Good 8.8% |
| Immigrants | Ethiopia | 62.5 /100 | #167 | Good 8.9% |