Greek vs Immigrants from Sierra Leone Family Poverty
COMPARE
Greek
Immigrants from Sierra Leone
Family Poverty
Family Poverty Comparison
Greeks
Immigrants from Sierra Leone
7.5%
FAMILY POVERTY
99.4/ 100
METRIC RATING
35th/ 347
METRIC RANK
9.4%
FAMILY POVERTY
19.6/ 100
METRIC RATING
202nd/ 347
METRIC RANK
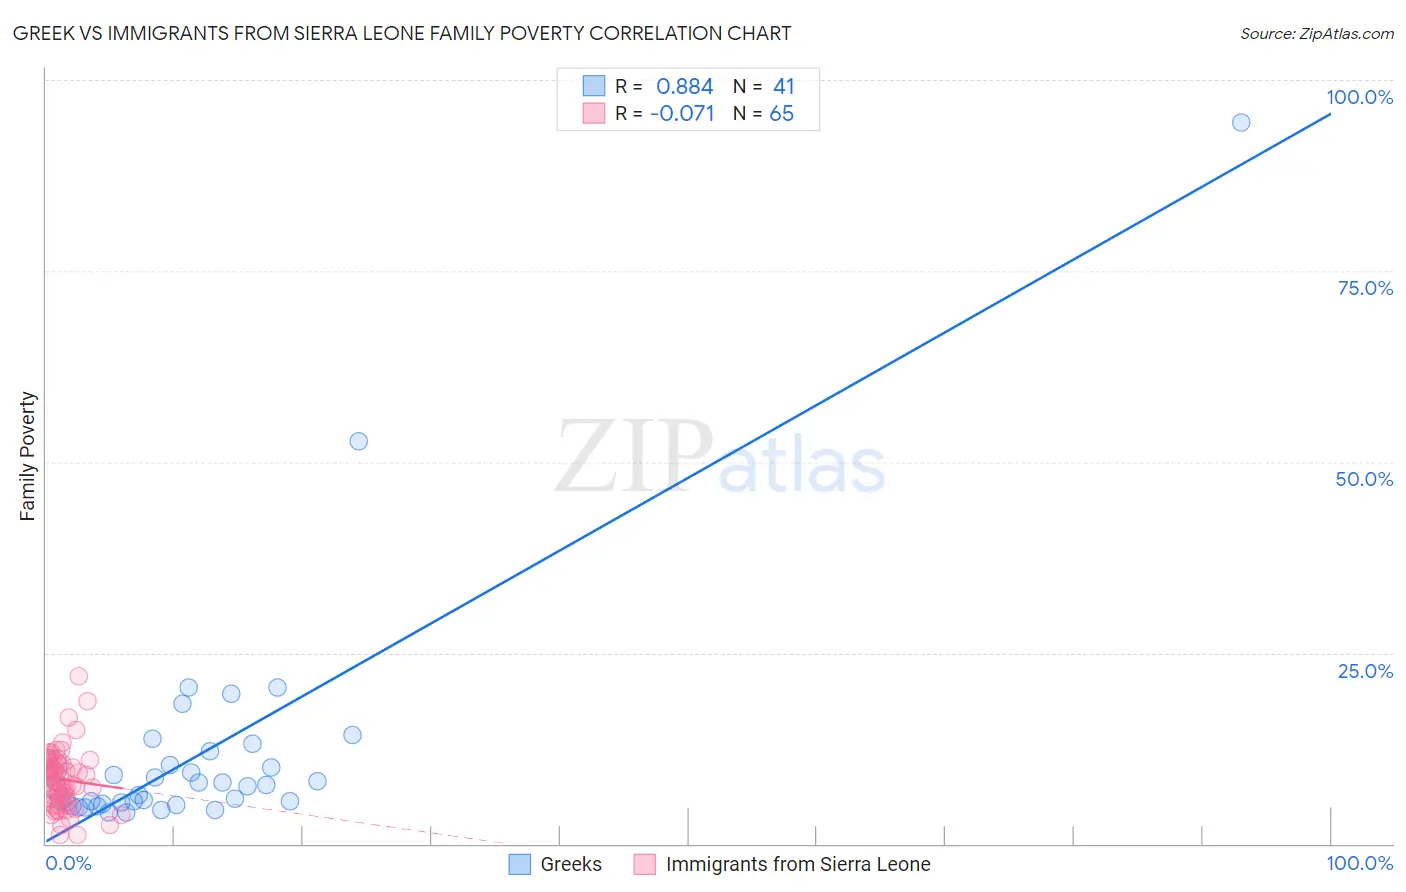
Greek vs Immigrants from Sierra Leone Family Poverty Correlation Chart
The statistical analysis conducted on geographies consisting of 480,426,664 people shows a very strong positive correlation between the proportion of Greeks and poverty level among families in the United States with a correlation coefficient (R) of 0.884 and weighted average of 7.5%. Similarly, the statistical analysis conducted on geographies consisting of 101,579,524 people shows a slight negative correlation between the proportion of Immigrants from Sierra Leone and poverty level among families in the United States with a correlation coefficient (R) of -0.071 and weighted average of 9.4%, a difference of 25.5%.
Family Poverty Correlation Summary
| Measurement | Greek | Immigrants from Sierra Leone |
| Minimum | 4.1% | 1.1% |
| Maximum | 94.4% | 21.9% |
| Range | 90.3% | 20.8% |
| Mean | 11.7% | 8.4% |
| Median | 7.5% | 8.1% |
| Interquartile 25% (IQ1) | 5.3% | 5.5% |
| Interquartile 75% (IQ3) | 11.2% | 10.6% |
| Interquartile Range (IQR) | 5.9% | 5.1% |
| Standard Deviation (Sample) | 15.6% | 3.9% |
| Standard Deviation (Population) | 15.4% | 3.9% |
Similar Demographics by Family Poverty
Demographics Similar to Greeks by Family Poverty
In terms of family poverty, the demographic groups most similar to Greeks are Turkish (7.5%, a difference of 0.010%), Estonian (7.5%, a difference of 0.18%), Bolivian (7.5%, a difference of 0.43%), Carpatho Rusyn (7.5%, a difference of 0.49%), and Slovene (7.5%, a difference of 0.52%).
| Demographics | Rating | Rank | Family Poverty |
| Immigrants | Korea | 99.6 /100 | #28 | Exceptional 7.4% |
| Immigrants | Northern Europe | 99.6 /100 | #29 | Exceptional 7.4% |
| Italians | 99.6 /100 | #30 | Exceptional 7.4% |
| Czechs | 99.6 /100 | #31 | Exceptional 7.4% |
| Poles | 99.5 /100 | #32 | Exceptional 7.4% |
| Immigrants | Japan | 99.5 /100 | #33 | Exceptional 7.4% |
| Russians | 99.5 /100 | #34 | Exceptional 7.5% |
| Greeks | 99.4 /100 | #35 | Exceptional 7.5% |
| Turks | 99.4 /100 | #36 | Exceptional 7.5% |
| Estonians | 99.4 /100 | #37 | Exceptional 7.5% |
| Bolivians | 99.3 /100 | #38 | Exceptional 7.5% |
| Carpatho Rusyns | 99.3 /100 | #39 | Exceptional 7.5% |
| Slovenes | 99.3 /100 | #40 | Exceptional 7.5% |
| Immigrants | Australia | 99.2 /100 | #41 | Exceptional 7.6% |
| Scandinavians | 99.1 /100 | #42 | Exceptional 7.6% |
Demographics Similar to Immigrants from Sierra Leone by Family Poverty
In terms of family poverty, the demographic groups most similar to Immigrants from Sierra Leone are German Russian (9.4%, a difference of 0.040%), Immigrants from Lebanon (9.4%, a difference of 0.14%), Immigrants from Portugal (9.4%, a difference of 0.17%), Aleut (9.5%, a difference of 0.33%), and Immigrants from South America (9.5%, a difference of 0.34%).
| Demographics | Rating | Rank | Family Poverty |
| Venezuelans | 27.4 /100 | #195 | Fair 9.3% |
| Immigrants | Venezuela | 26.1 /100 | #196 | Fair 9.3% |
| Immigrants | Colombia | 24.4 /100 | #197 | Fair 9.3% |
| Iraqis | 24.2 /100 | #198 | Fair 9.3% |
| Spaniards | 22.8 /100 | #199 | Fair 9.4% |
| Immigrants | Costa Rica | 21.7 /100 | #200 | Fair 9.4% |
| Immigrants | Portugal | 20.5 /100 | #201 | Fair 9.4% |
| Immigrants | Sierra Leone | 19.6 /100 | #202 | Poor 9.4% |
| German Russians | 19.4 /100 | #203 | Poor 9.4% |
| Immigrants | Lebanon | 18.9 /100 | #204 | Poor 9.4% |
| Aleuts | 18.0 /100 | #205 | Poor 9.5% |
| Immigrants | South America | 18.0 /100 | #206 | Poor 9.5% |
| Sierra Leoneans | 15.6 /100 | #207 | Poor 9.5% |
| Immigrants | Eastern Africa | 15.1 /100 | #208 | Poor 9.5% |
| Immigrants | Uruguay | 14.0 /100 | #209 | Poor 9.5% |