Immigrants from Laos vs Hungarian Family Poverty
COMPARE
Immigrants from Laos
Hungarian
Family Poverty
Family Poverty Comparison
Immigrants from Laos
Hungarians
10.2%
FAMILY POVERTY
1.7/ 100
METRIC RATING
237th/ 347
METRIC RANK
8.8%
FAMILY POVERTY
67.2/ 100
METRIC RATING
160th/ 347
METRIC RANK
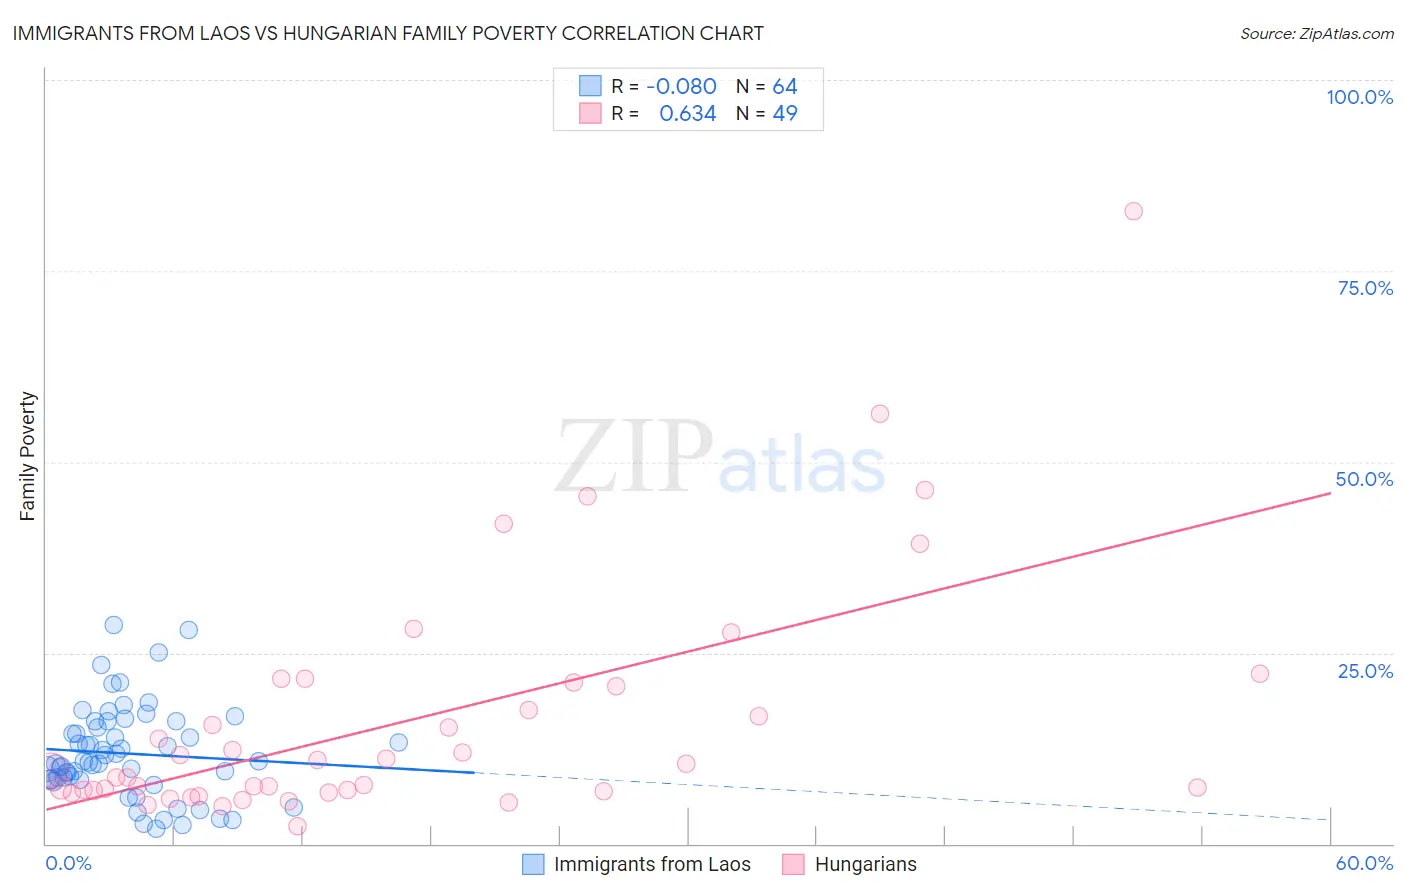
Immigrants from Laos vs Hungarian Family Poverty Correlation Chart
The statistical analysis conducted on geographies consisting of 201,335,644 people shows a slight negative correlation between the proportion of Immigrants from Laos and poverty level among families in the United States with a correlation coefficient (R) of -0.080 and weighted average of 10.2%. Similarly, the statistical analysis conducted on geographies consisting of 483,762,053 people shows a significant positive correlation between the proportion of Hungarians and poverty level among families in the United States with a correlation coefficient (R) of 0.634 and weighted average of 8.8%, a difference of 16.0%.
Family Poverty Correlation Summary
| Measurement | Immigrants from Laos | Hungarian |
| Minimum | 2.0% | 2.4% |
| Maximum | 28.6% | 82.8% |
| Range | 26.6% | 80.4% |
| Mean | 11.8% | 16.1% |
| Median | 10.7% | 9.5% |
| Interquartile 25% (IQ1) | 8.4% | 6.9% |
| Interquartile 75% (IQ3) | 15.6% | 20.9% |
| Interquartile Range (IQR) | 7.2% | 13.9% |
| Standard Deviation (Sample) | 6.0% | 15.7% |
| Standard Deviation (Population) | 5.9% | 15.6% |
Similar Demographics by Family Poverty
Demographics Similar to Immigrants from Laos by Family Poverty
In terms of family poverty, the demographic groups most similar to Immigrants from Laos are Immigrants from Nigeria (10.2%, a difference of 0.26%), French American Indian (10.2%, a difference of 0.36%), Potawatomi (10.2%, a difference of 0.40%), Nigerian (10.1%, a difference of 0.51%), and Immigrants from Middle Africa (10.1%, a difference of 0.54%).
| Demographics | Rating | Rank | Family Poverty |
| Immigrants | Panama | 3.1 /100 | #230 | Tragic 10.0% |
| Alaskan Athabascans | 2.7 /100 | #231 | Tragic 10.1% |
| Immigrants | Sudan | 2.3 /100 | #232 | Tragic 10.1% |
| Fijians | 2.1 /100 | #233 | Tragic 10.1% |
| Immigrants | Middle Africa | 2.1 /100 | #234 | Tragic 10.1% |
| Nigerians | 2.0 /100 | #235 | Tragic 10.1% |
| Immigrants | Nigeria | 1.9 /100 | #236 | Tragic 10.2% |
| Immigrants | Laos | 1.7 /100 | #237 | Tragic 10.2% |
| French American Indians | 1.5 /100 | #238 | Tragic 10.2% |
| Potawatomi | 1.5 /100 | #239 | Tragic 10.2% |
| Immigrants | Azores | 1.4 /100 | #240 | Tragic 10.3% |
| Ghanaians | 1.3 /100 | #241 | Tragic 10.3% |
| Alaska Natives | 1.0 /100 | #242 | Tragic 10.4% |
| Nepalese | 0.8 /100 | #243 | Tragic 10.4% |
| Cree | 0.7 /100 | #244 | Tragic 10.5% |
Demographics Similar to Hungarians by Family Poverty
In terms of family poverty, the demographic groups most similar to Hungarians are Immigrants from Northern Africa (8.8%, a difference of 0.040%), Peruvian (8.8%, a difference of 0.13%), Ethiopian (8.8%, a difference of 0.13%), Pennsylvania German (8.8%, a difference of 0.18%), and White/Caucasian (8.8%, a difference of 0.30%).
| Demographics | Rating | Rank | Family Poverty |
| Immigrants | Spain | 79.1 /100 | #153 | Good 8.6% |
| Immigrants | Vietnam | 75.4 /100 | #154 | Good 8.7% |
| Immigrants | Kuwait | 73.6 /100 | #155 | Good 8.7% |
| Immigrants | Oceania | 71.2 /100 | #156 | Good 8.7% |
| Tsimshian | 69.3 /100 | #157 | Good 8.8% |
| Whites/Caucasians | 69.1 /100 | #158 | Good 8.8% |
| Peruvians | 68.0 /100 | #159 | Good 8.8% |
| Hungarians | 67.2 /100 | #160 | Good 8.8% |
| Immigrants | Northern Africa | 66.9 /100 | #161 | Good 8.8% |
| Ethiopians | 66.3 /100 | #162 | Good 8.8% |
| Pennsylvania Germans | 66.0 /100 | #163 | Good 8.8% |
| Celtics | 64.9 /100 | #164 | Good 8.8% |
| Guamanians/Chamorros | 64.7 /100 | #165 | Good 8.8% |
| Afghans | 63.5 /100 | #166 | Good 8.8% |
| Immigrants | Ethiopia | 62.5 /100 | #167 | Good 8.9% |