Greek vs Alsatian Receiving Food Stamps
COMPARE
Greek
Alsatian
Receiving Food Stamps
Receiving Food Stamps Comparison
Greeks
Alsatians
9.7%
RECEIVING FOOD STAMPS
99.3/ 100
METRIC RATING
57th/ 347
METRIC RANK
11.4%
RECEIVING FOOD STAMPS
68.0/ 100
METRIC RATING
162nd/ 347
METRIC RANK
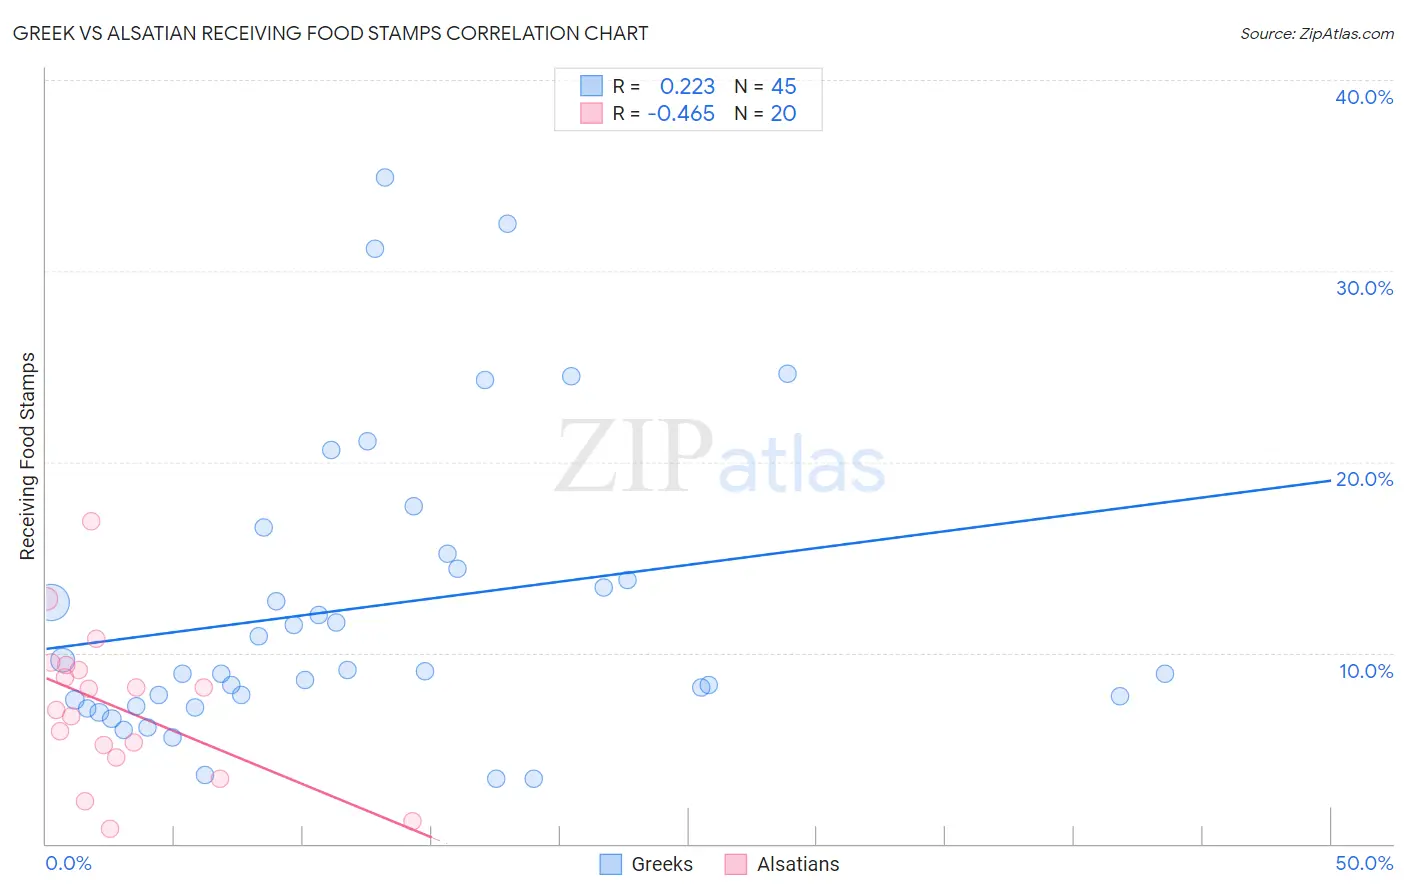
Greek vs Alsatian Receiving Food Stamps Correlation Chart
The statistical analysis conducted on geographies consisting of 480,606,207 people shows a weak positive correlation between the proportion of Greeks and percentage of population receiving government assistance and/or food stamps in the United States with a correlation coefficient (R) of 0.223 and weighted average of 9.7%. Similarly, the statistical analysis conducted on geographies consisting of 82,623,919 people shows a moderate negative correlation between the proportion of Alsatians and percentage of population receiving government assistance and/or food stamps in the United States with a correlation coefficient (R) of -0.465 and weighted average of 11.4%, a difference of 17.5%.
Receiving Food Stamps Correlation Summary
| Measurement | Greek | Alsatian |
| Minimum | 3.4% | 0.80% |
| Maximum | 34.9% | 16.9% |
| Range | 31.5% | 16.1% |
| Mean | 12.4% | 7.2% |
| Median | 9.0% | 7.6% |
| Interquartile 25% (IQ1) | 7.4% | 4.8% |
| Interquartile 75% (IQ3) | 14.8% | 9.2% |
| Interquartile Range (IQR) | 7.4% | 4.4% |
| Standard Deviation (Sample) | 7.7% | 3.9% |
| Standard Deviation (Population) | 7.7% | 3.8% |
Similar Demographics by Receiving Food Stamps
Demographics Similar to Greeks by Receiving Food Stamps
In terms of receiving food stamps, the demographic groups most similar to Greeks are Scandinavian (9.7%, a difference of 0.060%), British (9.7%, a difference of 0.090%), Immigrants from Canada (9.7%, a difference of 0.11%), German (9.7%, a difference of 0.19%), and Immigrants from Switzerland (9.7%, a difference of 0.29%).
| Demographics | Rating | Rank | Receiving Food Stamps |
| Lithuanians | 99.4 /100 | #50 | Exceptional 9.7% |
| Asians | 99.3 /100 | #51 | Exceptional 9.7% |
| Immigrants | South Africa | 99.3 /100 | #52 | Exceptional 9.7% |
| Tongans | 99.3 /100 | #53 | Exceptional 9.7% |
| Swiss | 99.3 /100 | #54 | Exceptional 9.7% |
| Immigrants | Switzerland | 99.3 /100 | #55 | Exceptional 9.7% |
| Immigrants | Canada | 99.3 /100 | #56 | Exceptional 9.7% |
| Greeks | 99.3 /100 | #57 | Exceptional 9.7% |
| Scandinavians | 99.2 /100 | #58 | Exceptional 9.7% |
| British | 99.2 /100 | #59 | Exceptional 9.7% |
| Germans | 99.2 /100 | #60 | Exceptional 9.7% |
| English | 99.2 /100 | #61 | Exceptional 9.8% |
| Immigrants | Bulgaria | 99.2 /100 | #62 | Exceptional 9.8% |
| Chinese | 99.2 /100 | #63 | Exceptional 9.8% |
| Immigrants | North America | 99.2 /100 | #64 | Exceptional 9.8% |
Demographics Similar to Alsatians by Receiving Food Stamps
In terms of receiving food stamps, the demographic groups most similar to Alsatians are Pennsylvania German (11.4%, a difference of 0.060%), French Canadian (11.4%, a difference of 0.25%), Immigrants from Southern Europe (11.5%, a difference of 0.37%), Immigrants from Oceania (11.4%, a difference of 0.41%), and Immigrants from Chile (11.5%, a difference of 0.48%).
| Demographics | Rating | Rank | Receiving Food Stamps |
| Immigrants | Argentina | 80.4 /100 | #155 | Excellent 11.2% |
| Immigrants | Afghanistan | 75.6 /100 | #156 | Good 11.3% |
| Immigrants | Lebanon | 75.2 /100 | #157 | Good 11.3% |
| Immigrants | Bosnia and Herzegovina | 72.6 /100 | #158 | Good 11.3% |
| Immigrants | Oceania | 70.4 /100 | #159 | Good 11.4% |
| French Canadians | 69.5 /100 | #160 | Good 11.4% |
| Pennsylvania Germans | 68.4 /100 | #161 | Good 11.4% |
| Alsatians | 68.0 /100 | #162 | Good 11.4% |
| Immigrants | Southern Europe | 65.8 /100 | #163 | Good 11.5% |
| Immigrants | Chile | 65.0 /100 | #164 | Good 11.5% |
| Arabs | 64.7 /100 | #165 | Good 11.5% |
| Immigrants | Belarus | 62.8 /100 | #166 | Good 11.5% |
| Kenyans | 60.2 /100 | #167 | Good 11.6% |
| Tlingit-Haida | 59.1 /100 | #168 | Average 11.6% |
| Immigrants | Eastern Africa | 58.3 /100 | #169 | Average 11.6% |