Delaware vs Alsatian Receiving Food Stamps
COMPARE
Delaware
Alsatian
Receiving Food Stamps
Receiving Food Stamps Comparison
Delaware
Alsatians
12.2%
RECEIVING FOOD STAMPS
26.1/ 100
METRIC RATING
197th/ 347
METRIC RANK
11.4%
RECEIVING FOOD STAMPS
68.0/ 100
METRIC RATING
162nd/ 347
METRIC RANK
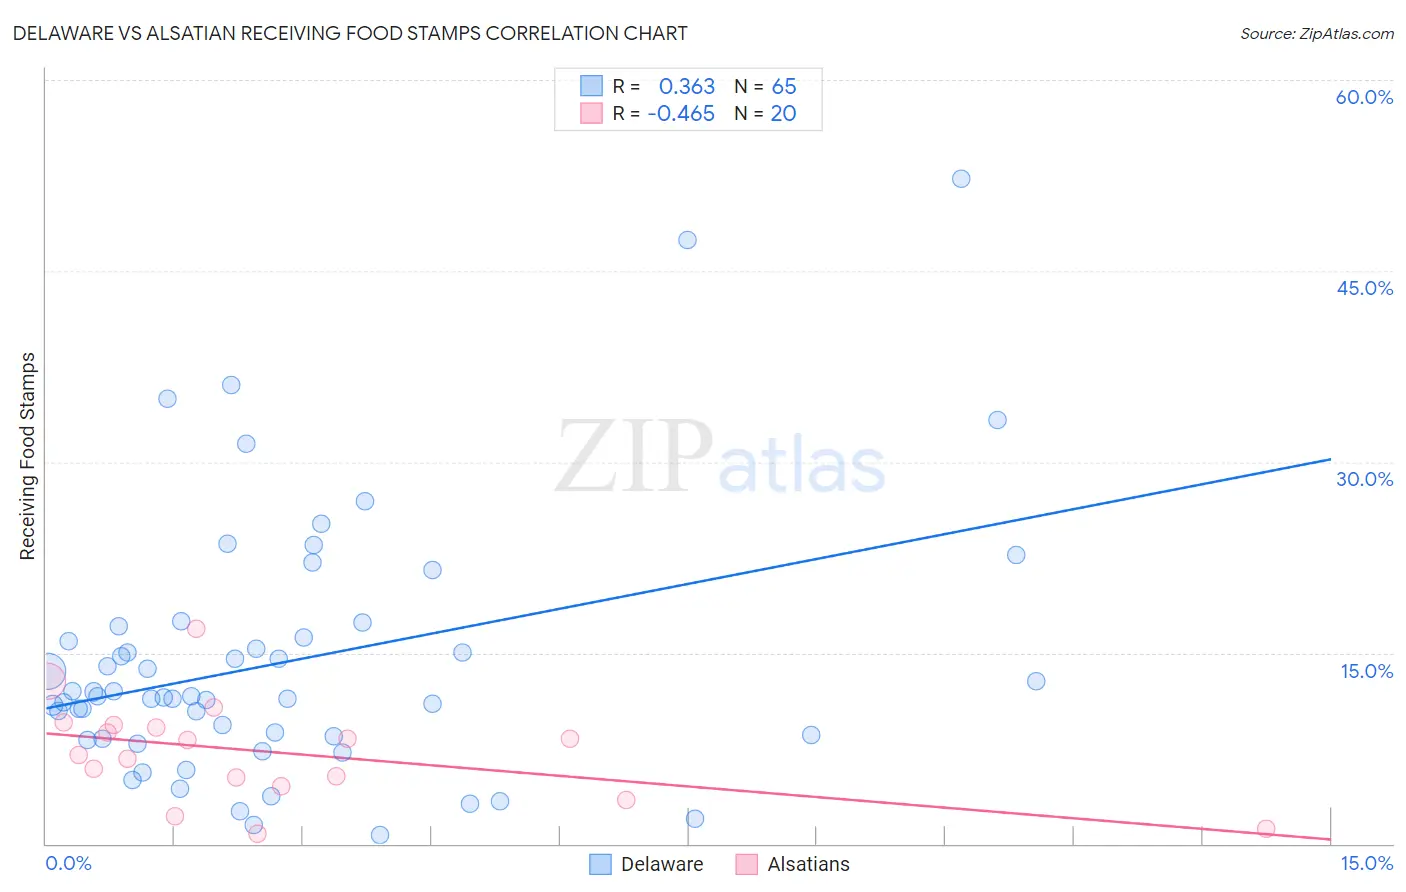
Delaware vs Alsatian Receiving Food Stamps Correlation Chart
The statistical analysis conducted on geographies consisting of 96,117,712 people shows a mild positive correlation between the proportion of Delaware and percentage of population receiving government assistance and/or food stamps in the United States with a correlation coefficient (R) of 0.363 and weighted average of 12.2%. Similarly, the statistical analysis conducted on geographies consisting of 82,623,919 people shows a moderate negative correlation between the proportion of Alsatians and percentage of population receiving government assistance and/or food stamps in the United States with a correlation coefficient (R) of -0.465 and weighted average of 11.4%, a difference of 6.5%.
Receiving Food Stamps Correlation Summary
| Measurement | Delaware | Alsatian |
| Minimum | 0.70% | 0.80% |
| Maximum | 52.2% | 16.9% |
| Range | 51.5% | 16.1% |
| Mean | 14.3% | 7.2% |
| Median | 11.6% | 7.6% |
| Interquartile 25% (IQ1) | 8.4% | 4.8% |
| Interquartile 75% (IQ3) | 16.7% | 9.2% |
| Interquartile Range (IQR) | 8.3% | 4.4% |
| Standard Deviation (Sample) | 10.1% | 3.9% |
| Standard Deviation (Population) | 10.1% | 3.8% |
Similar Demographics by Receiving Food Stamps
Demographics Similar to Delaware by Receiving Food Stamps
In terms of receiving food stamps, the demographic groups most similar to Delaware are Iraqi (12.2%, a difference of 0.080%), American (12.2%, a difference of 0.11%), Immigrants from Costa Rica (12.2%, a difference of 0.13%), Immigrants from Sudan (12.1%, a difference of 0.17%), and Portuguese (12.2%, a difference of 0.18%).
| Demographics | Rating | Rank | Receiving Food Stamps |
| Immigrants | Peru | 32.2 /100 | #190 | Fair 12.0% |
| Venezuelans | 32.1 /100 | #191 | Fair 12.0% |
| Samoans | 31.0 /100 | #192 | Fair 12.1% |
| Immigrants | Fiji | 27.8 /100 | #193 | Fair 12.1% |
| Immigrants | Sudan | 27.1 /100 | #194 | Fair 12.1% |
| Americans | 26.7 /100 | #195 | Fair 12.2% |
| Iraqis | 26.6 /100 | #196 | Fair 12.2% |
| Delaware | 26.1 /100 | #197 | Fair 12.2% |
| Immigrants | Costa Rica | 25.4 /100 | #198 | Fair 12.2% |
| Portuguese | 25.1 /100 | #199 | Fair 12.2% |
| Sierra Leoneans | 23.6 /100 | #200 | Fair 12.2% |
| Ugandans | 22.5 /100 | #201 | Fair 12.2% |
| Immigrants | Venezuela | 20.1 /100 | #202 | Fair 12.3% |
| Shoshone | 17.7 /100 | #203 | Poor 12.4% |
| Immigrants | Nonimmigrants | 17.6 /100 | #204 | Poor 12.4% |
Demographics Similar to Alsatians by Receiving Food Stamps
In terms of receiving food stamps, the demographic groups most similar to Alsatians are Pennsylvania German (11.4%, a difference of 0.060%), French Canadian (11.4%, a difference of 0.25%), Immigrants from Southern Europe (11.5%, a difference of 0.37%), Immigrants from Oceania (11.4%, a difference of 0.41%), and Immigrants from Chile (11.5%, a difference of 0.48%).
| Demographics | Rating | Rank | Receiving Food Stamps |
| Immigrants | Argentina | 80.4 /100 | #155 | Excellent 11.2% |
| Immigrants | Afghanistan | 75.6 /100 | #156 | Good 11.3% |
| Immigrants | Lebanon | 75.2 /100 | #157 | Good 11.3% |
| Immigrants | Bosnia and Herzegovina | 72.6 /100 | #158 | Good 11.3% |
| Immigrants | Oceania | 70.4 /100 | #159 | Good 11.4% |
| French Canadians | 69.5 /100 | #160 | Good 11.4% |
| Pennsylvania Germans | 68.4 /100 | #161 | Good 11.4% |
| Alsatians | 68.0 /100 | #162 | Good 11.4% |
| Immigrants | Southern Europe | 65.8 /100 | #163 | Good 11.5% |
| Immigrants | Chile | 65.0 /100 | #164 | Good 11.5% |
| Arabs | 64.7 /100 | #165 | Good 11.5% |
| Immigrants | Belarus | 62.8 /100 | #166 | Good 11.5% |
| Kenyans | 60.2 /100 | #167 | Good 11.6% |
| Tlingit-Haida | 59.1 /100 | #168 | Average 11.6% |
| Immigrants | Eastern Africa | 58.3 /100 | #169 | Average 11.6% |