Fijian vs Immigrants from Nepal Female Poverty
COMPARE
Fijian
Immigrants from Nepal
Female Poverty
Female Poverty Comparison
Fijians
Immigrants from Nepal
14.9%
FEMALE POVERTY
1.1/ 100
METRIC RATING
234th/ 347
METRIC RANK
13.3%
FEMALE POVERTY
62.7/ 100
METRIC RATING
160th/ 347
METRIC RANK
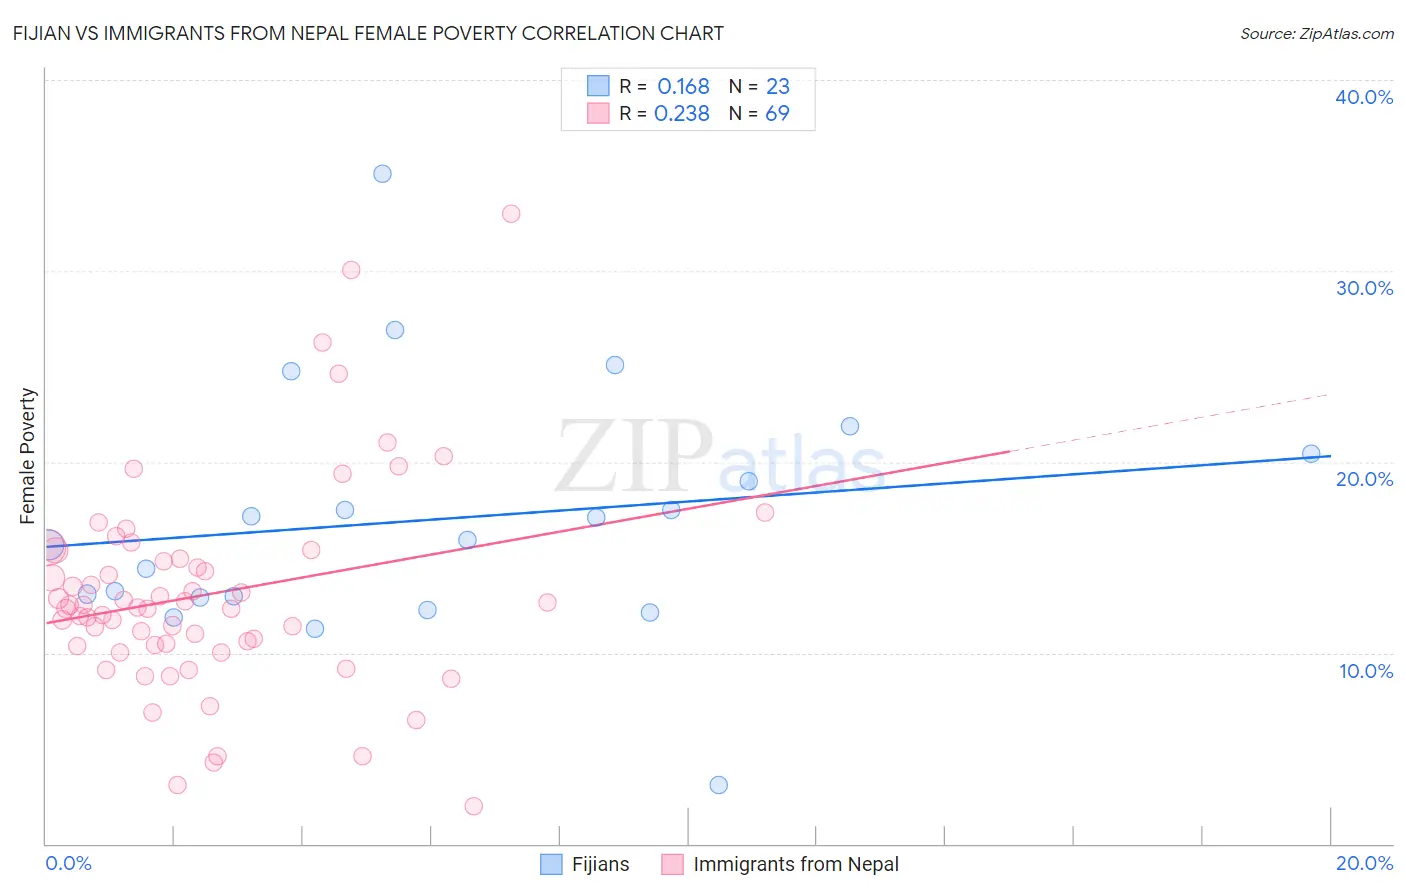
Fijian vs Immigrants from Nepal Female Poverty Correlation Chart
The statistical analysis conducted on geographies consisting of 55,946,752 people shows a poor positive correlation between the proportion of Fijians and poverty level among females in the United States with a correlation coefficient (R) of 0.168 and weighted average of 14.9%. Similarly, the statistical analysis conducted on geographies consisting of 186,688,907 people shows a weak positive correlation between the proportion of Immigrants from Nepal and poverty level among females in the United States with a correlation coefficient (R) of 0.238 and weighted average of 13.3%, a difference of 12.2%.
Female Poverty Correlation Summary
| Measurement | Fijian | Immigrants from Nepal |
| Minimum | 3.1% | 2.0% |
| Maximum | 35.1% | 33.0% |
| Range | 32.0% | 31.0% |
| Mean | 17.0% | 13.1% |
| Median | 15.9% | 12.4% |
| Interquartile 25% (IQ1) | 12.9% | 10.4% |
| Interquartile 75% (IQ3) | 20.4% | 15.2% |
| Interquartile Range (IQR) | 7.6% | 4.8% |
| Standard Deviation (Sample) | 6.6% | 5.5% |
| Standard Deviation (Population) | 6.5% | 5.5% |
Similar Demographics by Female Poverty
Demographics Similar to Fijians by Female Poverty
In terms of female poverty, the demographic groups most similar to Fijians are Immigrants from Laos (15.0%, a difference of 0.44%), Immigrants from Saudi Arabia (14.8%, a difference of 0.52%), Osage (14.8%, a difference of 0.62%), Nigerian (14.8%, a difference of 0.93%), and Alaska Native (14.7%, a difference of 1.0%).
| Demographics | Rating | Rank | Female Poverty |
| Immigrants | Nigeria | 2.1 /100 | #227 | Tragic 14.7% |
| German Russians | 2.0 /100 | #228 | Tragic 14.7% |
| Ghanaians | 1.9 /100 | #229 | Tragic 14.7% |
| Alaska Natives | 1.8 /100 | #230 | Tragic 14.7% |
| Nigerians | 1.7 /100 | #231 | Tragic 14.8% |
| Osage | 1.5 /100 | #232 | Tragic 14.8% |
| Immigrants | Saudi Arabia | 1.4 /100 | #233 | Tragic 14.8% |
| Fijians | 1.1 /100 | #234 | Tragic 14.9% |
| Immigrants | Laos | 0.9 /100 | #235 | Tragic 15.0% |
| Cree | 0.7 /100 | #236 | Tragic 15.1% |
| French American Indians | 0.6 /100 | #237 | Tragic 15.1% |
| Immigrants | Armenia | 0.6 /100 | #238 | Tragic 15.1% |
| Immigrants | Middle Africa | 0.5 /100 | #239 | Tragic 15.2% |
| Sudanese | 0.5 /100 | #240 | Tragic 15.2% |
| Immigrants | Sudan | 0.4 /100 | #241 | Tragic 15.2% |
Demographics Similar to Immigrants from Nepal by Female Poverty
In terms of female poverty, the demographic groups most similar to Immigrants from Nepal are Immigrants from Ethiopia (13.3%, a difference of 0.030%), Guamanian/Chamorro (13.3%, a difference of 0.030%), Immigrants from Albania (13.3%, a difference of 0.040%), Ethiopian (13.3%, a difference of 0.050%), and Scotch-Irish (13.3%, a difference of 0.070%).
| Demographics | Rating | Rank | Female Poverty |
| Immigrants | Fiji | 71.0 /100 | #153 | Good 13.2% |
| Armenians | 70.4 /100 | #154 | Good 13.2% |
| Hungarians | 70.1 /100 | #155 | Good 13.2% |
| Immigrants | Bosnia and Herzegovina | 69.7 /100 | #156 | Good 13.2% |
| Immigrants | Northern Africa | 68.8 /100 | #157 | Good 13.2% |
| Pennsylvania Germans | 67.3 /100 | #158 | Good 13.2% |
| Costa Ricans | 63.6 /100 | #159 | Good 13.3% |
| Immigrants | Nepal | 62.7 /100 | #160 | Good 13.3% |
| Immigrants | Ethiopia | 62.5 /100 | #161 | Good 13.3% |
| Guamanians/Chamorros | 62.4 /100 | #162 | Good 13.3% |
| Immigrants | Albania | 62.4 /100 | #163 | Good 13.3% |
| Ethiopians | 62.3 /100 | #164 | Good 13.3% |
| Scotch-Irish | 62.1 /100 | #165 | Good 13.3% |
| Immigrants | Oceania | 59.7 /100 | #166 | Average 13.3% |
| Immigrants | Chile | 57.4 /100 | #167 | Average 13.3% |