Fijian vs Immigrants from Morocco Female Poverty
COMPARE
Fijian
Immigrants from Morocco
Female Poverty
Female Poverty Comparison
Fijians
Immigrants from Morocco
14.9%
FEMALE POVERTY
1.1/ 100
METRIC RATING
234th/ 347
METRIC RANK
13.4%
FEMALE POVERTY
49.4/ 100
METRIC RATING
177th/ 347
METRIC RANK
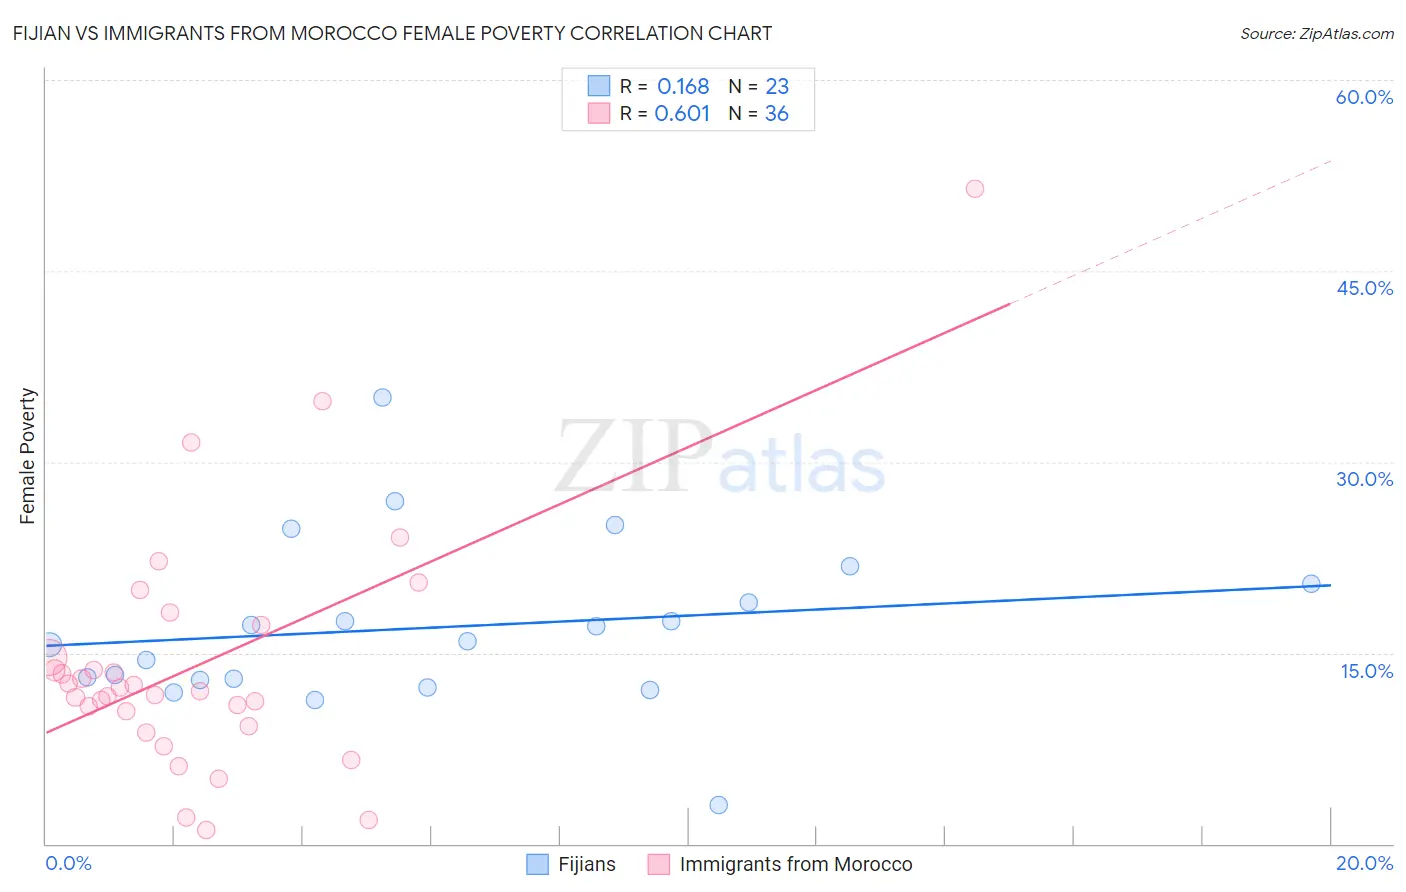
Fijian vs Immigrants from Morocco Female Poverty Correlation Chart
The statistical analysis conducted on geographies consisting of 55,946,752 people shows a poor positive correlation between the proportion of Fijians and poverty level among females in the United States with a correlation coefficient (R) of 0.168 and weighted average of 14.9%. Similarly, the statistical analysis conducted on geographies consisting of 178,904,508 people shows a significant positive correlation between the proportion of Immigrants from Morocco and poverty level among females in the United States with a correlation coefficient (R) of 0.601 and weighted average of 13.4%, a difference of 10.7%.
Female Poverty Correlation Summary
| Measurement | Fijian | Immigrants from Morocco |
| Minimum | 3.1% | 1.1% |
| Maximum | 35.1% | 51.5% |
| Range | 32.0% | 50.4% |
| Mean | 17.0% | 14.1% |
| Median | 15.9% | 12.1% |
| Interquartile 25% (IQ1) | 12.9% | 9.8% |
| Interquartile 75% (IQ3) | 20.4% | 15.9% |
| Interquartile Range (IQR) | 7.6% | 6.1% |
| Standard Deviation (Sample) | 6.6% | 9.6% |
| Standard Deviation (Population) | 6.5% | 9.5% |
Similar Demographics by Female Poverty
Demographics Similar to Fijians by Female Poverty
In terms of female poverty, the demographic groups most similar to Fijians are Immigrants from Laos (15.0%, a difference of 0.44%), Immigrants from Saudi Arabia (14.8%, a difference of 0.52%), Osage (14.8%, a difference of 0.62%), Nigerian (14.8%, a difference of 0.93%), and Alaska Native (14.7%, a difference of 1.0%).
| Demographics | Rating | Rank | Female Poverty |
| Immigrants | Nigeria | 2.1 /100 | #227 | Tragic 14.7% |
| German Russians | 2.0 /100 | #228 | Tragic 14.7% |
| Ghanaians | 1.9 /100 | #229 | Tragic 14.7% |
| Alaska Natives | 1.8 /100 | #230 | Tragic 14.7% |
| Nigerians | 1.7 /100 | #231 | Tragic 14.8% |
| Osage | 1.5 /100 | #232 | Tragic 14.8% |
| Immigrants | Saudi Arabia | 1.4 /100 | #233 | Tragic 14.8% |
| Fijians | 1.1 /100 | #234 | Tragic 14.9% |
| Immigrants | Laos | 0.9 /100 | #235 | Tragic 15.0% |
| Cree | 0.7 /100 | #236 | Tragic 15.1% |
| French American Indians | 0.6 /100 | #237 | Tragic 15.1% |
| Immigrants | Armenia | 0.6 /100 | #238 | Tragic 15.1% |
| Immigrants | Middle Africa | 0.5 /100 | #239 | Tragic 15.2% |
| Sudanese | 0.5 /100 | #240 | Tragic 15.2% |
| Immigrants | Sudan | 0.4 /100 | #241 | Tragic 15.2% |
Demographics Similar to Immigrants from Morocco by Female Poverty
In terms of female poverty, the demographic groups most similar to Immigrants from Morocco are Israeli (13.5%, a difference of 0.030%), Immigrants from Spain (13.4%, a difference of 0.040%), Celtic (13.4%, a difference of 0.050%), Immigrants from Iraq (13.4%, a difference of 0.060%), and Immigrants from Syria (13.5%, a difference of 0.060%).
| Demographics | Rating | Rank | Female Poverty |
| Colombians | 55.7 /100 | #170 | Average 13.4% |
| Whites/Caucasians | 54.6 /100 | #171 | Average 13.4% |
| Mongolians | 53.6 /100 | #172 | Average 13.4% |
| Immigrants | Afghanistan | 50.8 /100 | #173 | Average 13.4% |
| Immigrants | Iraq | 50.0 /100 | #174 | Average 13.4% |
| Celtics | 49.9 /100 | #175 | Average 13.4% |
| Immigrants | Spain | 49.9 /100 | #176 | Average 13.4% |
| Immigrants | Morocco | 49.4 /100 | #177 | Average 13.4% |
| Israelis | 49.1 /100 | #178 | Average 13.5% |
| Immigrants | Syria | 48.8 /100 | #179 | Average 13.5% |
| South Americans | 44.8 /100 | #180 | Average 13.5% |
| Venezuelans | 44.5 /100 | #181 | Average 13.5% |
| Immigrants | Colombia | 44.5 /100 | #182 | Average 13.5% |
| Kenyans | 43.8 /100 | #183 | Average 13.5% |
| Immigrants | Sierra Leone | 43.2 /100 | #184 | Average 13.5% |