Fijian vs Immigrants from Zaire Female Poverty
COMPARE
Fijian
Immigrants from Zaire
Female Poverty
Female Poverty Comparison
Fijians
Immigrants from Zaire
14.9%
FEMALE POVERTY
1.1/ 100
METRIC RATING
234th/ 347
METRIC RANK
16.4%
FEMALE POVERTY
0.0/ 100
METRIC RATING
292nd/ 347
METRIC RANK
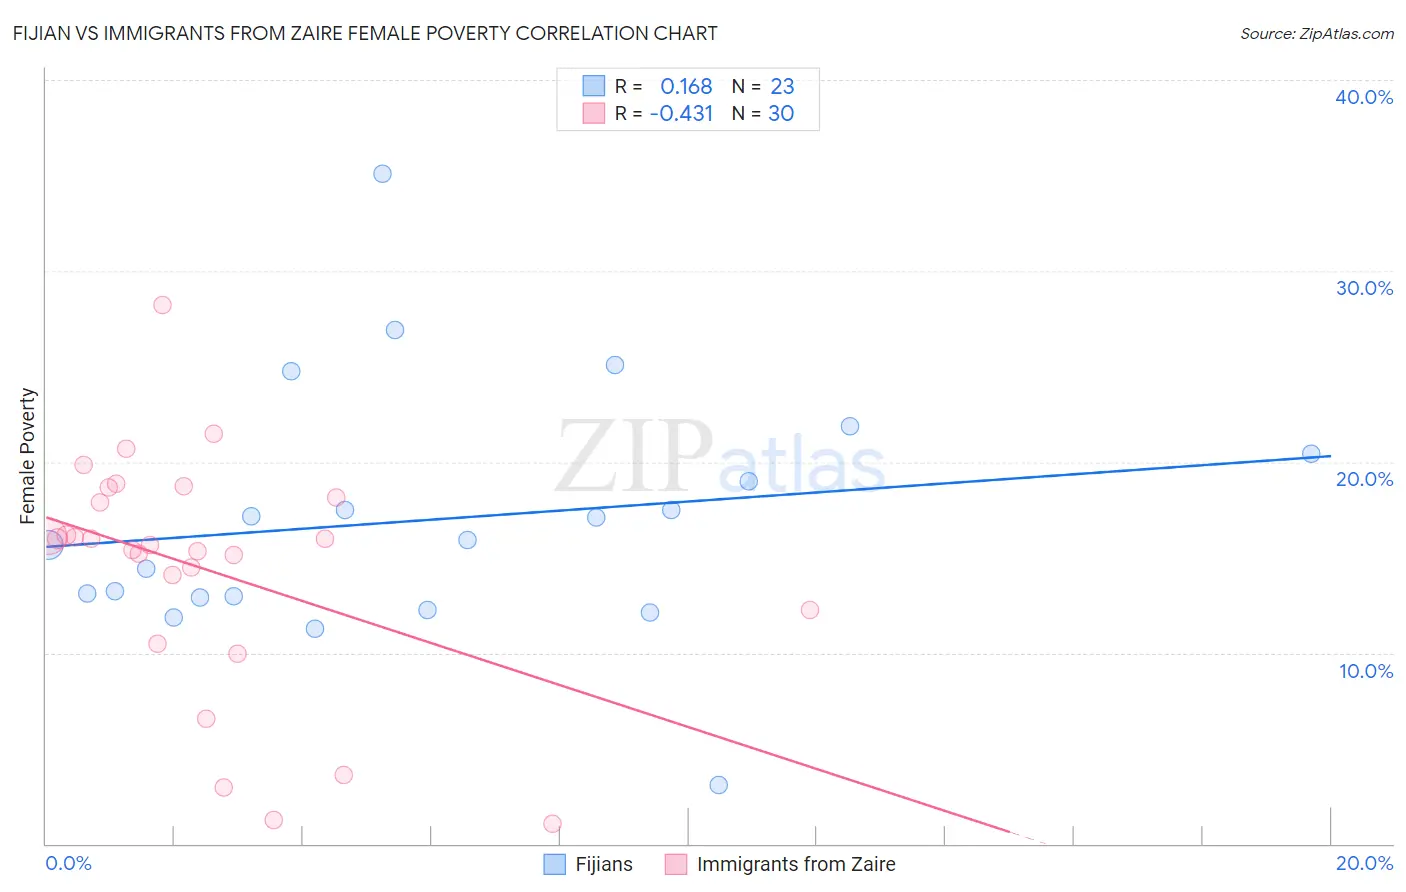
Fijian vs Immigrants from Zaire Female Poverty Correlation Chart
The statistical analysis conducted on geographies consisting of 55,946,752 people shows a poor positive correlation between the proportion of Fijians and poverty level among females in the United States with a correlation coefficient (R) of 0.168 and weighted average of 14.9%. Similarly, the statistical analysis conducted on geographies consisting of 107,241,785 people shows a moderate negative correlation between the proportion of Immigrants from Zaire and poverty level among females in the United States with a correlation coefficient (R) of -0.431 and weighted average of 16.4%, a difference of 10.3%.
Female Poverty Correlation Summary
| Measurement | Fijian | Immigrants from Zaire |
| Minimum | 3.1% | 1.0% |
| Maximum | 35.1% | 28.2% |
| Range | 32.0% | 27.2% |
| Mean | 17.0% | 14.4% |
| Median | 15.9% | 15.8% |
| Interquartile 25% (IQ1) | 12.9% | 12.3% |
| Interquartile 75% (IQ3) | 20.4% | 18.2% |
| Interquartile Range (IQR) | 7.6% | 5.9% |
| Standard Deviation (Sample) | 6.6% | 6.2% |
| Standard Deviation (Population) | 6.5% | 6.1% |
Similar Demographics by Female Poverty
Demographics Similar to Fijians by Female Poverty
In terms of female poverty, the demographic groups most similar to Fijians are Immigrants from Laos (15.0%, a difference of 0.44%), Immigrants from Saudi Arabia (14.8%, a difference of 0.52%), Osage (14.8%, a difference of 0.62%), Nigerian (14.8%, a difference of 0.93%), and Alaska Native (14.7%, a difference of 1.0%).
| Demographics | Rating | Rank | Female Poverty |
| Immigrants | Nigeria | 2.1 /100 | #227 | Tragic 14.7% |
| German Russians | 2.0 /100 | #228 | Tragic 14.7% |
| Ghanaians | 1.9 /100 | #229 | Tragic 14.7% |
| Alaska Natives | 1.8 /100 | #230 | Tragic 14.7% |
| Nigerians | 1.7 /100 | #231 | Tragic 14.8% |
| Osage | 1.5 /100 | #232 | Tragic 14.8% |
| Immigrants | Saudi Arabia | 1.4 /100 | #233 | Tragic 14.8% |
| Fijians | 1.1 /100 | #234 | Tragic 14.9% |
| Immigrants | Laos | 0.9 /100 | #235 | Tragic 15.0% |
| Cree | 0.7 /100 | #236 | Tragic 15.1% |
| French American Indians | 0.6 /100 | #237 | Tragic 15.1% |
| Immigrants | Armenia | 0.6 /100 | #238 | Tragic 15.1% |
| Immigrants | Middle Africa | 0.5 /100 | #239 | Tragic 15.2% |
| Sudanese | 0.5 /100 | #240 | Tragic 15.2% |
| Immigrants | Sudan | 0.4 /100 | #241 | Tragic 15.2% |
Demographics Similar to Immigrants from Zaire by Female Poverty
In terms of female poverty, the demographic groups most similar to Immigrants from Zaire are Yaqui (16.4%, a difference of 0.010%), Immigrants from Latin America (16.4%, a difference of 0.060%), Immigrants from Cabo Verde (16.4%, a difference of 0.090%), Senegalese (16.5%, a difference of 0.17%), and Immigrants from Bangladesh (16.4%, a difference of 0.18%).
| Demographics | Rating | Rank | Female Poverty |
| Comanche | 0.0 /100 | #285 | Tragic 16.2% |
| Inupiat | 0.0 /100 | #286 | Tragic 16.2% |
| Immigrants | Belize | 0.0 /100 | #287 | Tragic 16.3% |
| Indonesians | 0.0 /100 | #288 | Tragic 16.4% |
| Blackfeet | 0.0 /100 | #289 | Tragic 16.4% |
| Immigrants | Bangladesh | 0.0 /100 | #290 | Tragic 16.4% |
| Yaqui | 0.0 /100 | #291 | Tragic 16.4% |
| Immigrants | Zaire | 0.0 /100 | #292 | Tragic 16.4% |
| Immigrants | Latin America | 0.0 /100 | #293 | Tragic 16.4% |
| Immigrants | Cabo Verde | 0.0 /100 | #294 | Tragic 16.4% |
| Senegalese | 0.0 /100 | #295 | Tragic 16.5% |
| Immigrants | Senegal | 0.0 /100 | #296 | Tragic 16.5% |
| Mexicans | 0.0 /100 | #297 | Tragic 16.5% |
| Somalis | 0.0 /100 | #298 | Tragic 16.6% |
| Hispanics or Latinos | 0.0 /100 | #299 | Tragic 16.6% |