Estonian vs Immigrants from Jordan Family Poverty
COMPARE
Estonian
Immigrants from Jordan
Family Poverty
Family Poverty Comparison
Estonians
Immigrants from Jordan
7.5%
FAMILY POVERTY
99.4/ 100
METRIC RATING
37th/ 347
METRIC RANK
8.5%
FAMILY POVERTY
83.0/ 100
METRIC RATING
147th/ 347
METRIC RANK
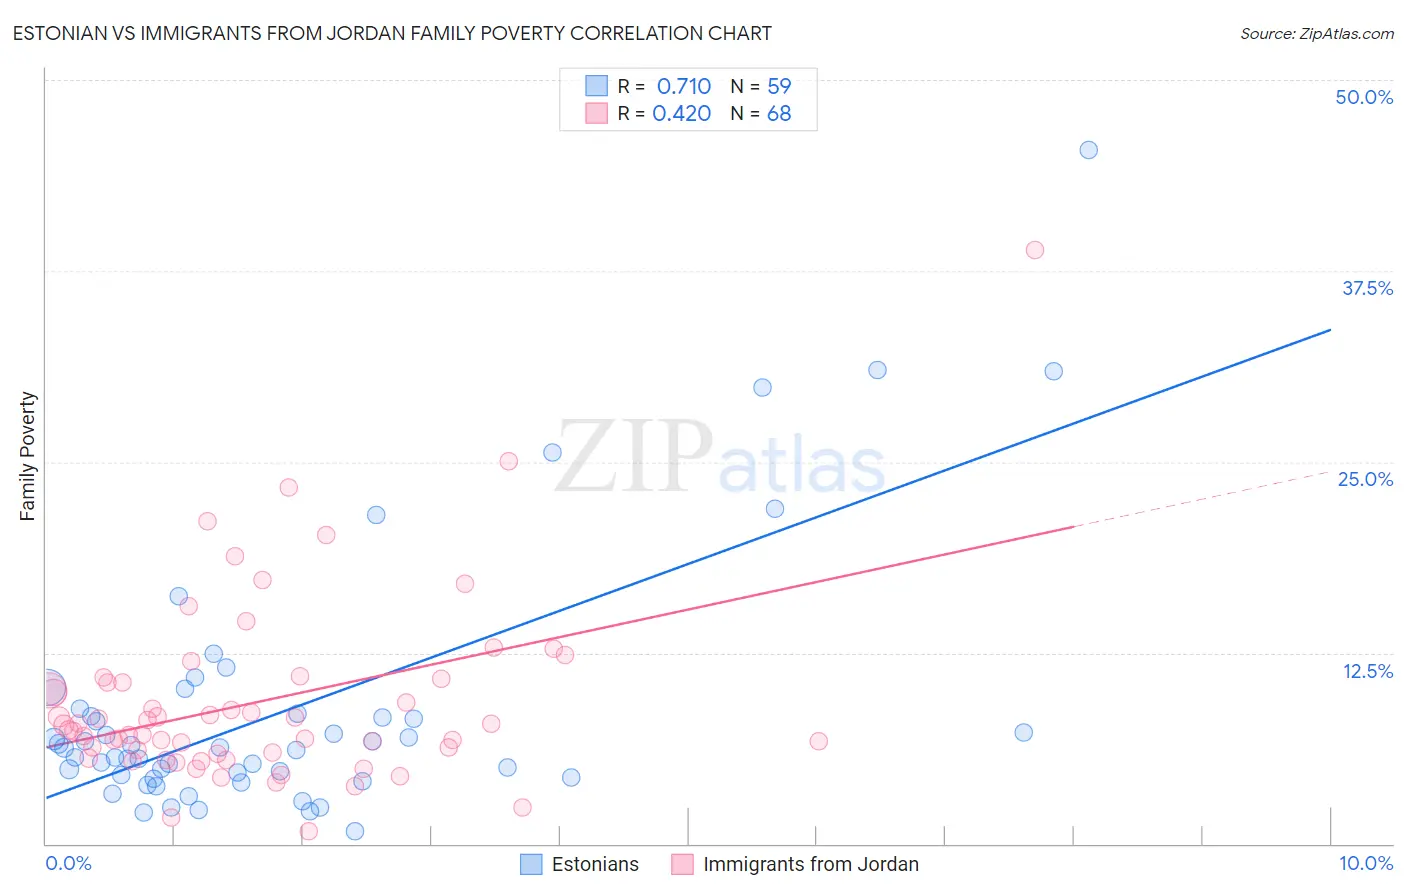
Estonian vs Immigrants from Jordan Family Poverty Correlation Chart
The statistical analysis conducted on geographies consisting of 123,321,798 people shows a strong positive correlation between the proportion of Estonians and poverty level among families in the United States with a correlation coefficient (R) of 0.710 and weighted average of 7.5%. Similarly, the statistical analysis conducted on geographies consisting of 181,199,618 people shows a moderate positive correlation between the proportion of Immigrants from Jordan and poverty level among families in the United States with a correlation coefficient (R) of 0.420 and weighted average of 8.5%, a difference of 13.5%.
Family Poverty Correlation Summary
| Measurement | Estonian | Immigrants from Jordan |
| Minimum | 0.86% | 0.79% |
| Maximum | 45.5% | 38.9% |
| Range | 44.6% | 38.1% |
| Mean | 8.8% | 9.3% |
| Median | 6.3% | 7.6% |
| Interquartile 25% (IQ1) | 4.3% | 6.0% |
| Interquartile 75% (IQ3) | 8.6% | 10.7% |
| Interquartile Range (IQR) | 4.3% | 4.7% |
| Standard Deviation (Sample) | 8.5% | 6.1% |
| Standard Deviation (Population) | 8.4% | 6.0% |
Similar Demographics by Family Poverty
Demographics Similar to Estonians by Family Poverty
In terms of family poverty, the demographic groups most similar to Estonians are Turkish (7.5%, a difference of 0.17%), Greek (7.5%, a difference of 0.18%), Bolivian (7.5%, a difference of 0.24%), Carpatho Rusyn (7.5%, a difference of 0.31%), and Slovene (7.5%, a difference of 0.34%).
| Demographics | Rating | Rank | Family Poverty |
| Italians | 99.6 /100 | #30 | Exceptional 7.4% |
| Czechs | 99.6 /100 | #31 | Exceptional 7.4% |
| Poles | 99.5 /100 | #32 | Exceptional 7.4% |
| Immigrants | Japan | 99.5 /100 | #33 | Exceptional 7.4% |
| Russians | 99.5 /100 | #34 | Exceptional 7.5% |
| Greeks | 99.4 /100 | #35 | Exceptional 7.5% |
| Turks | 99.4 /100 | #36 | Exceptional 7.5% |
| Estonians | 99.4 /100 | #37 | Exceptional 7.5% |
| Bolivians | 99.3 /100 | #38 | Exceptional 7.5% |
| Carpatho Rusyns | 99.3 /100 | #39 | Exceptional 7.5% |
| Slovenes | 99.3 /100 | #40 | Exceptional 7.5% |
| Immigrants | Australia | 99.2 /100 | #41 | Exceptional 7.6% |
| Scandinavians | 99.1 /100 | #42 | Exceptional 7.6% |
| Immigrants | Austria | 99.1 /100 | #43 | Exceptional 7.6% |
| Germans | 99.0 /100 | #44 | Exceptional 7.7% |
Demographics Similar to Immigrants from Jordan by Family Poverty
In terms of family poverty, the demographic groups most similar to Immigrants from Jordan are Immigrants from Belarus (8.5%, a difference of 0.030%), Immigrants from South Eastern Asia (8.5%, a difference of 0.050%), Albanian (8.5%, a difference of 0.060%), Immigrants from Germany (8.5%, a difference of 0.080%), and Yugoslavian (8.5%, a difference of 0.12%).
| Demographics | Rating | Rank | Family Poverty |
| Immigrants | Kazakhstan | 84.1 /100 | #140 | Excellent 8.5% |
| Immigrants | Ukraine | 83.9 /100 | #141 | Excellent 8.5% |
| Yugoslavians | 83.5 /100 | #142 | Excellent 8.5% |
| Immigrants | Germany | 83.3 /100 | #143 | Excellent 8.5% |
| Albanians | 83.3 /100 | #144 | Excellent 8.5% |
| Immigrants | South Eastern Asia | 83.2 /100 | #145 | Excellent 8.5% |
| Immigrants | Belarus | 83.2 /100 | #146 | Excellent 8.5% |
| Immigrants | Jordan | 83.0 /100 | #147 | Excellent 8.5% |
| Scotch-Irish | 82.2 /100 | #148 | Excellent 8.6% |
| Mongolians | 80.4 /100 | #149 | Excellent 8.6% |
| Syrians | 80.3 /100 | #150 | Excellent 8.6% |
| Brazilians | 80.1 /100 | #151 | Excellent 8.6% |
| Samoans | 79.8 /100 | #152 | Good 8.6% |
| Immigrants | Spain | 79.1 /100 | #153 | Good 8.6% |
| Immigrants | Vietnam | 75.4 /100 | #154 | Good 8.7% |