Spanish American Indian vs Immigrants from Jordan Family Poverty
COMPARE
Spanish American Indian
Immigrants from Jordan
Family Poverty
Family Poverty Comparison
Spanish American Indians
Immigrants from Jordan
10.9%
FAMILY POVERTY
0.2/ 100
METRIC RATING
262nd/ 347
METRIC RANK
8.5%
FAMILY POVERTY
83.0/ 100
METRIC RATING
147th/ 347
METRIC RANK
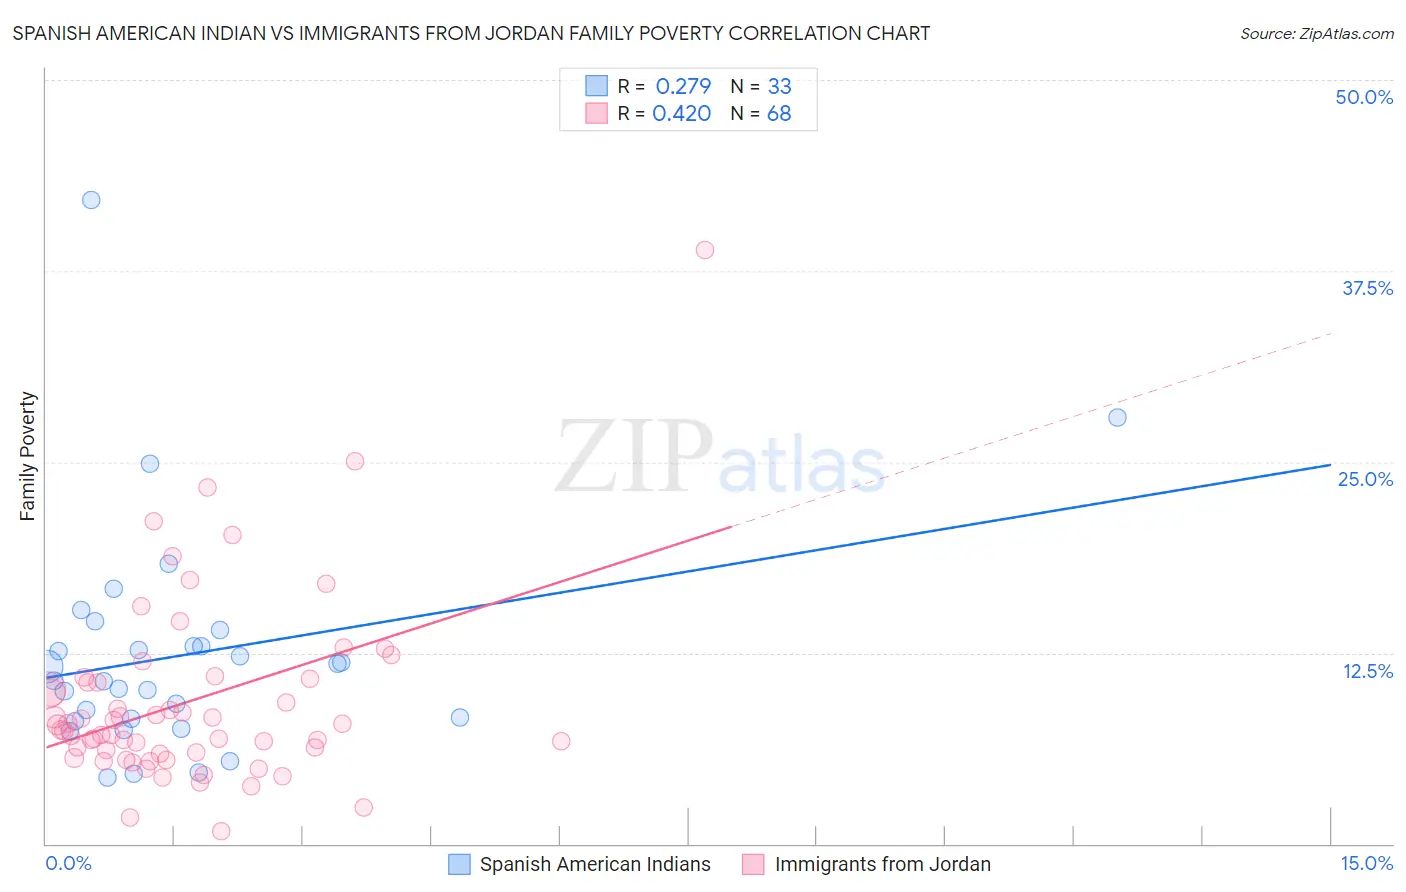
Spanish American Indian vs Immigrants from Jordan Family Poverty Correlation Chart
The statistical analysis conducted on geographies consisting of 73,121,787 people shows a weak positive correlation between the proportion of Spanish American Indians and poverty level among families in the United States with a correlation coefficient (R) of 0.279 and weighted average of 10.9%. Similarly, the statistical analysis conducted on geographies consisting of 181,199,618 people shows a moderate positive correlation between the proportion of Immigrants from Jordan and poverty level among families in the United States with a correlation coefficient (R) of 0.420 and weighted average of 8.5%, a difference of 27.8%.
Family Poverty Correlation Summary
| Measurement | Spanish American Indian | Immigrants from Jordan |
| Minimum | 4.4% | 0.79% |
| Maximum | 42.1% | 38.9% |
| Range | 37.8% | 38.1% |
| Mean | 12.4% | 9.3% |
| Median | 10.7% | 7.6% |
| Interquartile 25% (IQ1) | 8.1% | 6.0% |
| Interquartile 75% (IQ3) | 13.5% | 10.7% |
| Interquartile Range (IQR) | 5.4% | 4.7% |
| Standard Deviation (Sample) | 7.4% | 6.1% |
| Standard Deviation (Population) | 7.3% | 6.0% |
Similar Demographics by Family Poverty
Demographics Similar to Spanish American Indians by Family Poverty
In terms of family poverty, the demographic groups most similar to Spanish American Indians are Shoshone (10.9%, a difference of 0.13%), Bangladeshi (10.9%, a difference of 0.17%), Cape Verdean (10.9%, a difference of 0.26%), Trinidadian and Tobagonian (10.9%, a difference of 0.28%), and Immigrants from Trinidad and Tobago (10.9%, a difference of 0.33%).
| Demographics | Rating | Rank | Family Poverty |
| Immigrants | Liberia | 0.2 /100 | #255 | Tragic 10.8% |
| Chickasaw | 0.2 /100 | #256 | Tragic 10.8% |
| Immigrants | Ghana | 0.2 /100 | #257 | Tragic 10.8% |
| Sub-Saharan Africans | 0.2 /100 | #258 | Tragic 10.9% |
| Mexican American Indians | 0.2 /100 | #259 | Tragic 10.9% |
| Bangladeshis | 0.2 /100 | #260 | Tragic 10.9% |
| Shoshone | 0.2 /100 | #261 | Tragic 10.9% |
| Spanish American Indians | 0.2 /100 | #262 | Tragic 10.9% |
| Cape Verdeans | 0.1 /100 | #263 | Tragic 10.9% |
| Trinidadians and Tobagonians | 0.1 /100 | #264 | Tragic 10.9% |
| Immigrants | Trinidad and Tobago | 0.1 /100 | #265 | Tragic 10.9% |
| Immigrants | El Salvador | 0.1 /100 | #266 | Tragic 11.0% |
| Comanche | 0.1 /100 | #267 | Tragic 11.0% |
| Jamaicans | 0.1 /100 | #268 | Tragic 11.1% |
| Immigrants | Ecuador | 0.1 /100 | #269 | Tragic 11.1% |
Demographics Similar to Immigrants from Jordan by Family Poverty
In terms of family poverty, the demographic groups most similar to Immigrants from Jordan are Immigrants from Belarus (8.5%, a difference of 0.030%), Immigrants from South Eastern Asia (8.5%, a difference of 0.050%), Albanian (8.5%, a difference of 0.060%), Immigrants from Germany (8.5%, a difference of 0.080%), and Yugoslavian (8.5%, a difference of 0.12%).
| Demographics | Rating | Rank | Family Poverty |
| Immigrants | Kazakhstan | 84.1 /100 | #140 | Excellent 8.5% |
| Immigrants | Ukraine | 83.9 /100 | #141 | Excellent 8.5% |
| Yugoslavians | 83.5 /100 | #142 | Excellent 8.5% |
| Immigrants | Germany | 83.3 /100 | #143 | Excellent 8.5% |
| Albanians | 83.3 /100 | #144 | Excellent 8.5% |
| Immigrants | South Eastern Asia | 83.2 /100 | #145 | Excellent 8.5% |
| Immigrants | Belarus | 83.2 /100 | #146 | Excellent 8.5% |
| Immigrants | Jordan | 83.0 /100 | #147 | Excellent 8.5% |
| Scotch-Irish | 82.2 /100 | #148 | Excellent 8.6% |
| Mongolians | 80.4 /100 | #149 | Excellent 8.6% |
| Syrians | 80.3 /100 | #150 | Excellent 8.6% |
| Brazilians | 80.1 /100 | #151 | Excellent 8.6% |
| Samoans | 79.8 /100 | #152 | Good 8.6% |
| Immigrants | Spain | 79.1 /100 | #153 | Good 8.6% |
| Immigrants | Vietnam | 75.4 /100 | #154 | Good 8.7% |