Estonian vs American Family Poverty
COMPARE
Estonian
American
Family Poverty
Family Poverty Comparison
Estonians
Americans
7.5%
FAMILY POVERTY
99.4/ 100
METRIC RATING
37th/ 347
METRIC RANK
9.8%
FAMILY POVERTY
6.2/ 100
METRIC RATING
217th/ 347
METRIC RANK
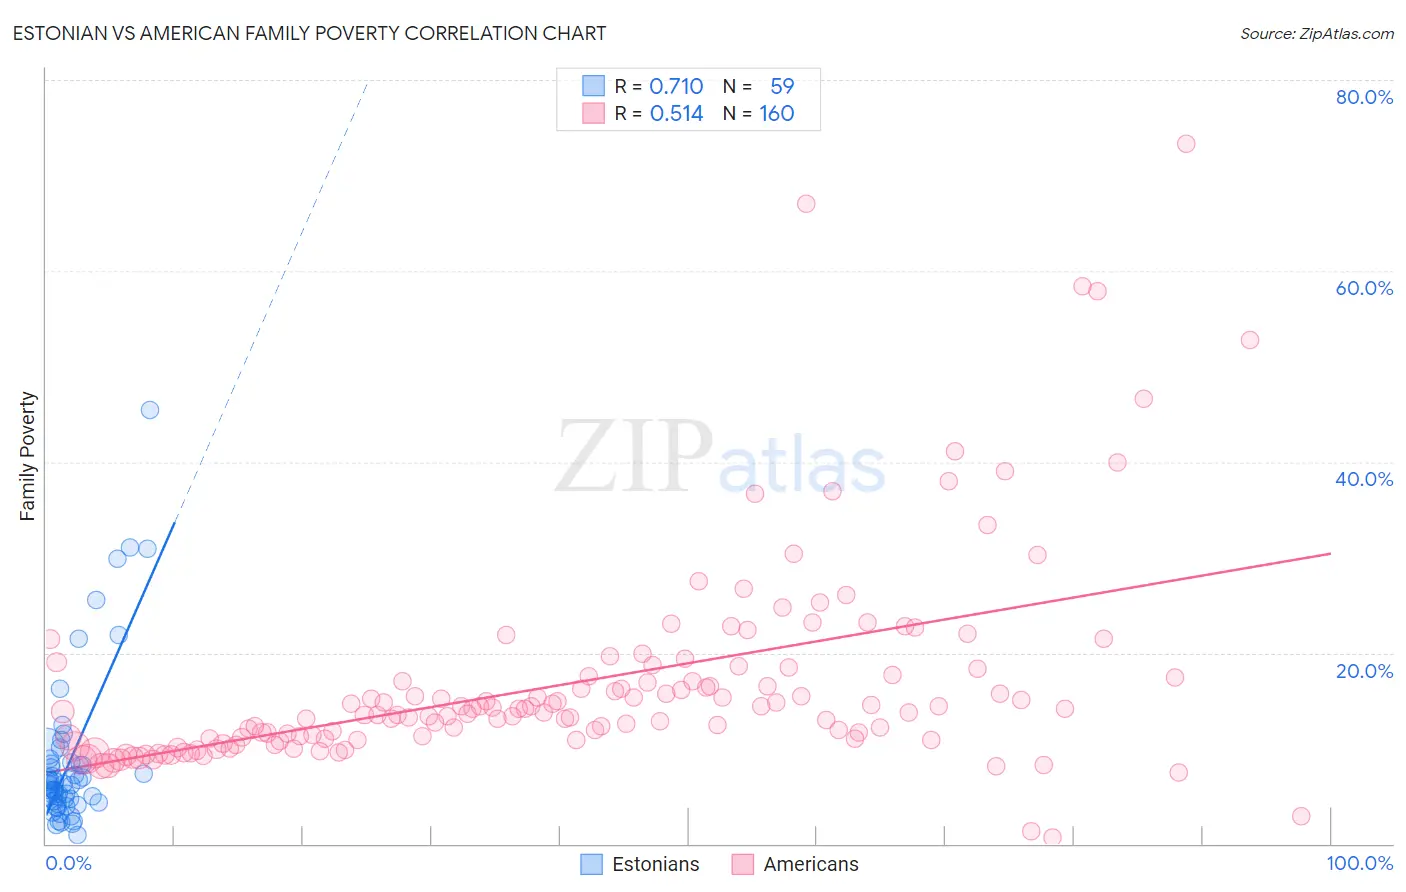
Estonian vs American Family Poverty Correlation Chart
The statistical analysis conducted on geographies consisting of 123,321,798 people shows a strong positive correlation between the proportion of Estonians and poverty level among families in the United States with a correlation coefficient (R) of 0.710 and weighted average of 7.5%. Similarly, the statistical analysis conducted on geographies consisting of 576,491,417 people shows a substantial positive correlation between the proportion of Americans and poverty level among families in the United States with a correlation coefficient (R) of 0.514 and weighted average of 9.8%, a difference of 30.4%.
Family Poverty Correlation Summary
| Measurement | Estonian | American |
| Minimum | 0.86% | 0.65% |
| Maximum | 45.5% | 73.3% |
| Range | 44.6% | 72.7% |
| Mean | 8.8% | 16.8% |
| Median | 6.3% | 13.8% |
| Interquartile 25% (IQ1) | 4.3% | 11.0% |
| Interquartile 75% (IQ3) | 8.6% | 17.6% |
| Interquartile Range (IQR) | 4.3% | 6.6% |
| Standard Deviation (Sample) | 8.5% | 11.0% |
| Standard Deviation (Population) | 8.4% | 11.0% |
Similar Demographics by Family Poverty
Demographics Similar to Estonians by Family Poverty
In terms of family poverty, the demographic groups most similar to Estonians are Turkish (7.5%, a difference of 0.17%), Greek (7.5%, a difference of 0.18%), Bolivian (7.5%, a difference of 0.24%), Carpatho Rusyn (7.5%, a difference of 0.31%), and Slovene (7.5%, a difference of 0.34%).
| Demographics | Rating | Rank | Family Poverty |
| Italians | 99.6 /100 | #30 | Exceptional 7.4% |
| Czechs | 99.6 /100 | #31 | Exceptional 7.4% |
| Poles | 99.5 /100 | #32 | Exceptional 7.4% |
| Immigrants | Japan | 99.5 /100 | #33 | Exceptional 7.4% |
| Russians | 99.5 /100 | #34 | Exceptional 7.5% |
| Greeks | 99.4 /100 | #35 | Exceptional 7.5% |
| Turks | 99.4 /100 | #36 | Exceptional 7.5% |
| Estonians | 99.4 /100 | #37 | Exceptional 7.5% |
| Bolivians | 99.3 /100 | #38 | Exceptional 7.5% |
| Carpatho Rusyns | 99.3 /100 | #39 | Exceptional 7.5% |
| Slovenes | 99.3 /100 | #40 | Exceptional 7.5% |
| Immigrants | Australia | 99.2 /100 | #41 | Exceptional 7.6% |
| Scandinavians | 99.1 /100 | #42 | Exceptional 7.6% |
| Immigrants | Austria | 99.1 /100 | #43 | Exceptional 7.6% |
| Germans | 99.0 /100 | #44 | Exceptional 7.7% |
Demographics Similar to Americans by Family Poverty
In terms of family poverty, the demographic groups most similar to Americans are Moroccan (9.8%, a difference of 0.20%), Nonimmigrants (9.8%, a difference of 0.26%), Immigrants from Micronesia (9.8%, a difference of 0.29%), Panamanian (9.8%, a difference of 0.32%), and Immigrants from Eritrea (9.9%, a difference of 0.44%).
| Demographics | Rating | Rank | Family Poverty |
| Alsatians | 11.3 /100 | #210 | Poor 9.6% |
| Malaysians | 10.6 /100 | #211 | Poor 9.6% |
| Immigrants | Thailand | 9.7 /100 | #212 | Tragic 9.7% |
| Osage | 8.0 /100 | #213 | Tragic 9.7% |
| Immigrants | Micronesia | 6.7 /100 | #214 | Tragic 9.8% |
| Immigrants | Nonimmigrants | 6.7 /100 | #215 | Tragic 9.8% |
| Moroccans | 6.5 /100 | #216 | Tragic 9.8% |
| Americans | 6.2 /100 | #217 | Tragic 9.8% |
| Panamanians | 5.6 /100 | #218 | Tragic 9.8% |
| Immigrants | Eritrea | 5.4 /100 | #219 | Tragic 9.9% |
| Bermudans | 5.3 /100 | #220 | Tragic 9.9% |
| Immigrants | Cambodia | 4.8 /100 | #221 | Tragic 9.9% |
| Japanese | 4.8 /100 | #222 | Tragic 9.9% |
| Immigrants | Africa | 4.3 /100 | #223 | Tragic 9.9% |
| Marshallese | 3.9 /100 | #224 | Tragic 9.9% |