Estonian vs Immigrants from Greece Family Poverty
COMPARE
Estonian
Immigrants from Greece
Family Poverty
Family Poverty Comparison
Estonians
Immigrants from Greece
7.5%
FAMILY POVERTY
99.4/ 100
METRIC RATING
37th/ 347
METRIC RANK
7.7%
FAMILY POVERTY
98.7/ 100
METRIC RATING
60th/ 347
METRIC RANK
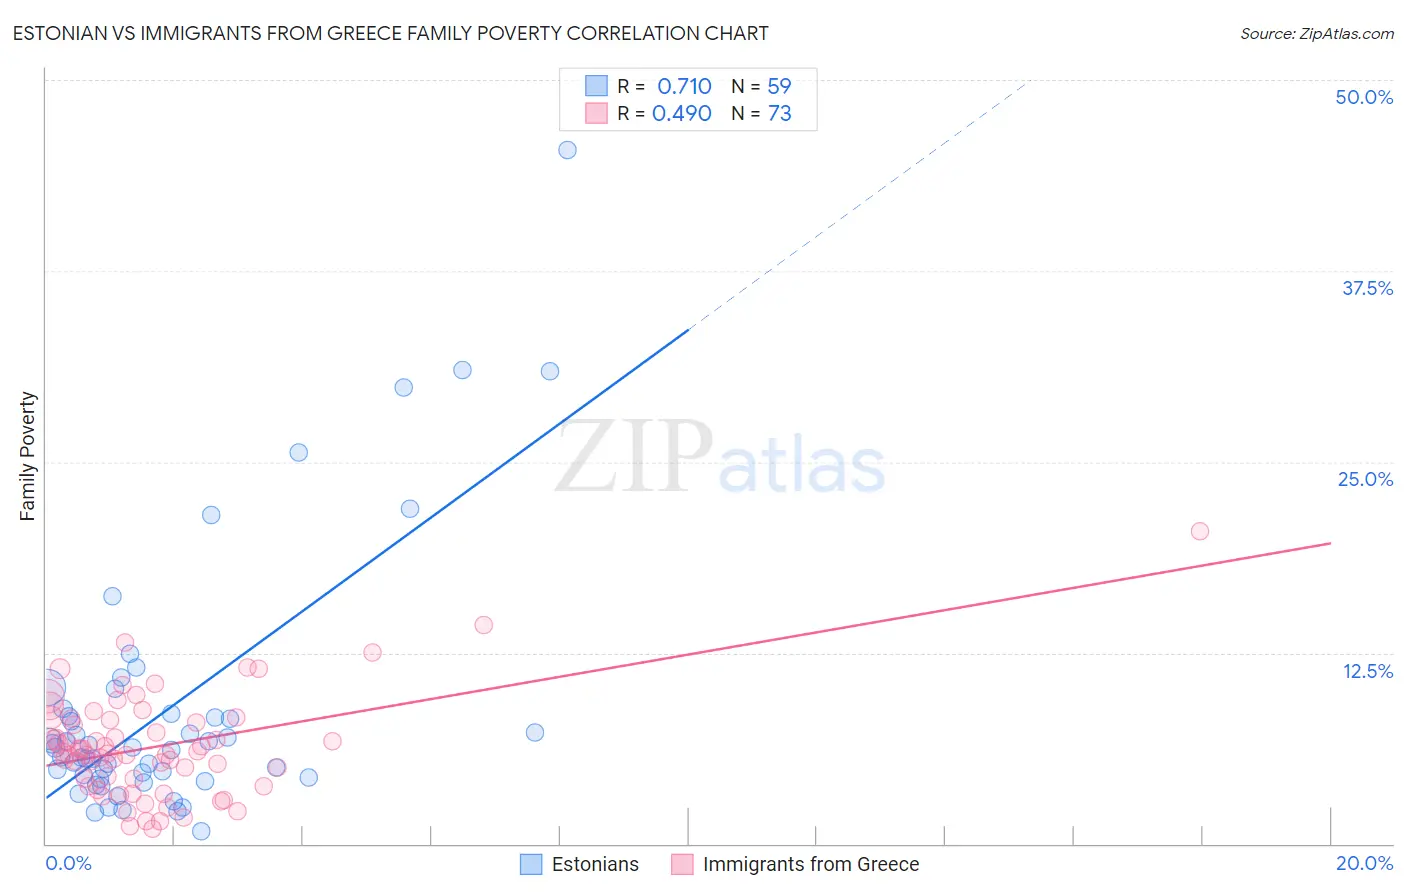
Estonian vs Immigrants from Greece Family Poverty Correlation Chart
The statistical analysis conducted on geographies consisting of 123,321,798 people shows a strong positive correlation between the proportion of Estonians and poverty level among families in the United States with a correlation coefficient (R) of 0.710 and weighted average of 7.5%. Similarly, the statistical analysis conducted on geographies consisting of 216,555,075 people shows a moderate positive correlation between the proportion of Immigrants from Greece and poverty level among families in the United States with a correlation coefficient (R) of 0.490 and weighted average of 7.7%, a difference of 2.8%.
Family Poverty Correlation Summary
| Measurement | Estonian | Immigrants from Greece |
| Minimum | 0.86% | 0.99% |
| Maximum | 45.5% | 20.5% |
| Range | 44.6% | 19.5% |
| Mean | 8.8% | 6.4% |
| Median | 6.3% | 6.0% |
| Interquartile 25% (IQ1) | 4.3% | 4.0% |
| Interquartile 75% (IQ3) | 8.6% | 8.1% |
| Interquartile Range (IQR) | 4.3% | 4.1% |
| Standard Deviation (Sample) | 8.5% | 3.4% |
| Standard Deviation (Population) | 8.4% | 3.4% |
Similar Demographics by Family Poverty
Demographics Similar to Estonians by Family Poverty
In terms of family poverty, the demographic groups most similar to Estonians are Turkish (7.5%, a difference of 0.17%), Greek (7.5%, a difference of 0.18%), Bolivian (7.5%, a difference of 0.24%), Carpatho Rusyn (7.5%, a difference of 0.31%), and Slovene (7.5%, a difference of 0.34%).
| Demographics | Rating | Rank | Family Poverty |
| Italians | 99.6 /100 | #30 | Exceptional 7.4% |
| Czechs | 99.6 /100 | #31 | Exceptional 7.4% |
| Poles | 99.5 /100 | #32 | Exceptional 7.4% |
| Immigrants | Japan | 99.5 /100 | #33 | Exceptional 7.4% |
| Russians | 99.5 /100 | #34 | Exceptional 7.5% |
| Greeks | 99.4 /100 | #35 | Exceptional 7.5% |
| Turks | 99.4 /100 | #36 | Exceptional 7.5% |
| Estonians | 99.4 /100 | #37 | Exceptional 7.5% |
| Bolivians | 99.3 /100 | #38 | Exceptional 7.5% |
| Carpatho Rusyns | 99.3 /100 | #39 | Exceptional 7.5% |
| Slovenes | 99.3 /100 | #40 | Exceptional 7.5% |
| Immigrants | Australia | 99.2 /100 | #41 | Exceptional 7.6% |
| Scandinavians | 99.1 /100 | #42 | Exceptional 7.6% |
| Immigrants | Austria | 99.1 /100 | #43 | Exceptional 7.6% |
| Germans | 99.0 /100 | #44 | Exceptional 7.7% |
Demographics Similar to Immigrants from Greece by Family Poverty
In terms of family poverty, the demographic groups most similar to Immigrants from Greece are European (7.7%, a difference of 0.010%), Finnish (7.7%, a difference of 0.020%), Asian (7.7%, a difference of 0.050%), Immigrants from Serbia (7.7%, a difference of 0.14%), and Immigrants from Eastern Asia (7.7%, a difference of 0.18%).
| Demographics | Rating | Rank | Family Poverty |
| Swiss | 98.8 /100 | #53 | Exceptional 7.7% |
| Immigrants | Sweden | 98.8 /100 | #54 | Exceptional 7.7% |
| Immigrants | Eastern Asia | 98.7 /100 | #55 | Exceptional 7.7% |
| Immigrants | Serbia | 98.7 /100 | #56 | Exceptional 7.7% |
| Asians | 98.7 /100 | #57 | Exceptional 7.7% |
| Finns | 98.7 /100 | #58 | Exceptional 7.7% |
| Europeans | 98.7 /100 | #59 | Exceptional 7.7% |
| Immigrants | Greece | 98.7 /100 | #60 | Exceptional 7.7% |
| Immigrants | Netherlands | 98.6 /100 | #61 | Exceptional 7.7% |
| Macedonians | 98.6 /100 | #62 | Exceptional 7.8% |
| Zimbabweans | 98.4 /100 | #63 | Exceptional 7.8% |
| Koreans | 98.3 /100 | #64 | Exceptional 7.8% |
| Immigrants | Bulgaria | 98.3 /100 | #65 | Exceptional 7.8% |
| Dutch | 98.3 /100 | #66 | Exceptional 7.8% |
| Northern Europeans | 98.3 /100 | #67 | Exceptional 7.8% |