Immigrants from Russia vs American Family Poverty
COMPARE
Immigrants from Russia
American
Family Poverty
Family Poverty Comparison
Immigrants from Russia
Americans
8.2%
FAMILY POVERTY
93.2/ 100
METRIC RATING
117th/ 347
METRIC RANK
9.8%
FAMILY POVERTY
6.2/ 100
METRIC RATING
217th/ 347
METRIC RANK
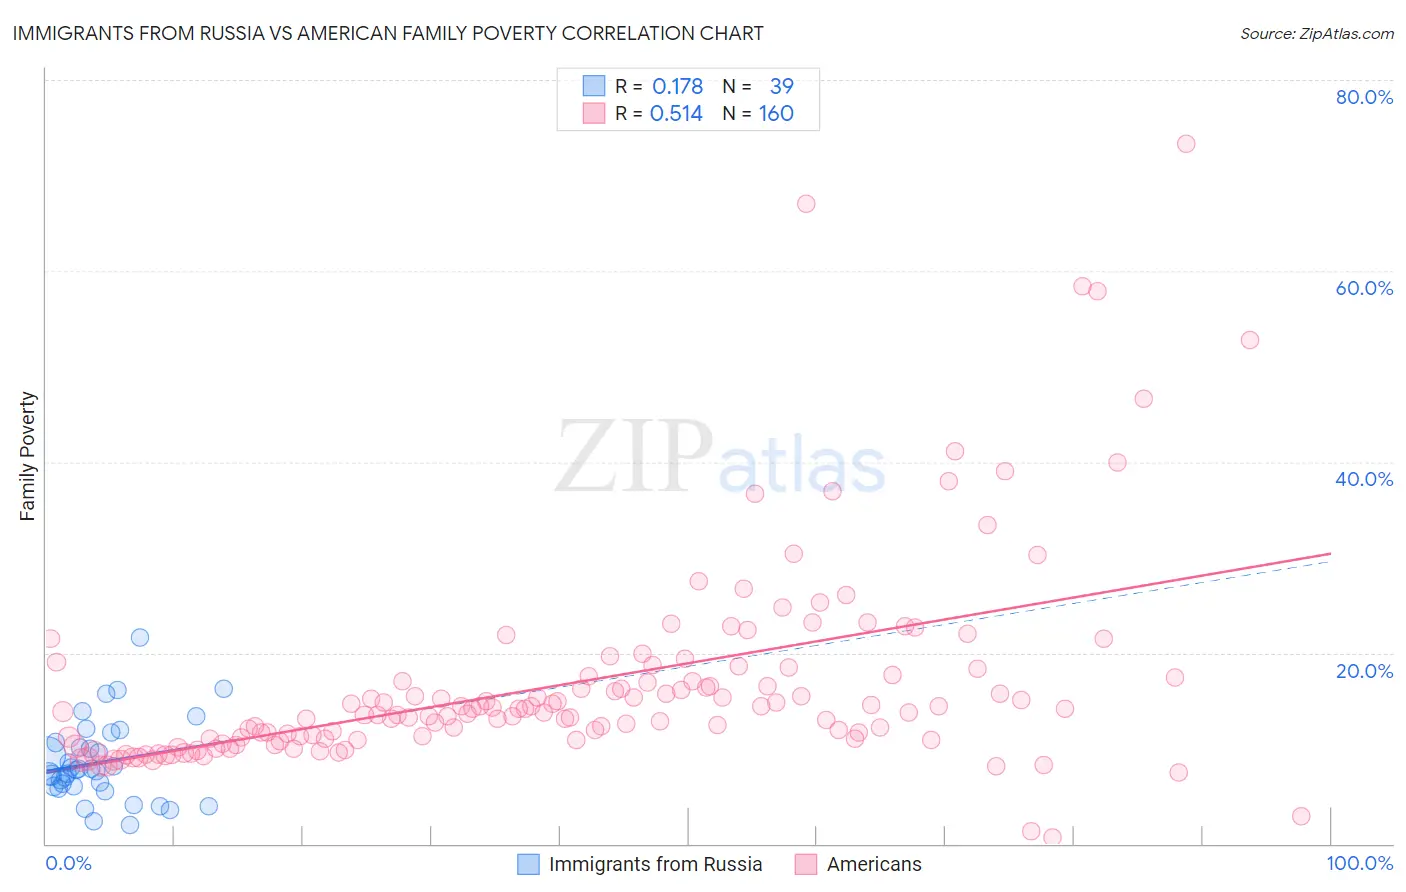
Immigrants from Russia vs American Family Poverty Correlation Chart
The statistical analysis conducted on geographies consisting of 347,005,908 people shows a poor positive correlation between the proportion of Immigrants from Russia and poverty level among families in the United States with a correlation coefficient (R) of 0.178 and weighted average of 8.2%. Similarly, the statistical analysis conducted on geographies consisting of 576,491,417 people shows a substantial positive correlation between the proportion of Americans and poverty level among families in the United States with a correlation coefficient (R) of 0.514 and weighted average of 9.8%, a difference of 19.2%.
Family Poverty Correlation Summary
| Measurement | Immigrants from Russia | American |
| Minimum | 1.9% | 0.65% |
| Maximum | 21.6% | 73.3% |
| Range | 19.6% | 72.7% |
| Mean | 8.5% | 16.8% |
| Median | 7.7% | 13.8% |
| Interquartile 25% (IQ1) | 6.0% | 11.0% |
| Interquartile 75% (IQ3) | 10.6% | 17.6% |
| Interquartile Range (IQR) | 4.6% | 6.6% |
| Standard Deviation (Sample) | 4.2% | 11.0% |
| Standard Deviation (Population) | 4.2% | 11.0% |
Similar Demographics by Family Poverty
Demographics Similar to Immigrants from Russia by Family Poverty
In terms of family poverty, the demographic groups most similar to Immigrants from Russia are South African (8.2%, a difference of 0.070%), Immigrants from Israel (8.2%, a difference of 0.13%), Immigrants from Western Europe (8.2%, a difference of 0.19%), French (8.3%, a difference of 0.26%), and Immigrants from Zimbabwe (8.2%, a difference of 0.47%).
| Demographics | Rating | Rank | Family Poverty |
| Romanians | 94.7 /100 | #110 | Exceptional 8.2% |
| Taiwanese | 94.6 /100 | #111 | Exceptional 8.2% |
| Immigrants | France | 94.4 /100 | #112 | Exceptional 8.2% |
| Canadians | 94.2 /100 | #113 | Exceptional 8.2% |
| Immigrants | Zimbabwe | 94.0 /100 | #114 | Exceptional 8.2% |
| Immigrants | Israel | 93.5 /100 | #115 | Exceptional 8.2% |
| South Africans | 93.4 /100 | #116 | Exceptional 8.2% |
| Immigrants | Russia | 93.2 /100 | #117 | Exceptional 8.2% |
| Immigrants | Western Europe | 92.9 /100 | #118 | Exceptional 8.2% |
| French | 92.8 /100 | #119 | Exceptional 8.3% |
| Immigrants | Egypt | 91.6 /100 | #120 | Exceptional 8.3% |
| Native Hawaiians | 91.3 /100 | #121 | Exceptional 8.3% |
| Paraguayans | 91.2 /100 | #122 | Exceptional 8.3% |
| Palestinians | 91.1 /100 | #123 | Exceptional 8.3% |
| Soviet Union | 90.8 /100 | #124 | Exceptional 8.3% |
Demographics Similar to Americans by Family Poverty
In terms of family poverty, the demographic groups most similar to Americans are Moroccan (9.8%, a difference of 0.20%), Nonimmigrants (9.8%, a difference of 0.26%), Immigrants from Micronesia (9.8%, a difference of 0.29%), Panamanian (9.8%, a difference of 0.32%), and Immigrants from Eritrea (9.9%, a difference of 0.44%).
| Demographics | Rating | Rank | Family Poverty |
| Alsatians | 11.3 /100 | #210 | Poor 9.6% |
| Malaysians | 10.6 /100 | #211 | Poor 9.6% |
| Immigrants | Thailand | 9.7 /100 | #212 | Tragic 9.7% |
| Osage | 8.0 /100 | #213 | Tragic 9.7% |
| Immigrants | Micronesia | 6.7 /100 | #214 | Tragic 9.8% |
| Immigrants | Nonimmigrants | 6.7 /100 | #215 | Tragic 9.8% |
| Moroccans | 6.5 /100 | #216 | Tragic 9.8% |
| Americans | 6.2 /100 | #217 | Tragic 9.8% |
| Panamanians | 5.6 /100 | #218 | Tragic 9.8% |
| Immigrants | Eritrea | 5.4 /100 | #219 | Tragic 9.9% |
| Bermudans | 5.3 /100 | #220 | Tragic 9.9% |
| Immigrants | Cambodia | 4.8 /100 | #221 | Tragic 9.9% |
| Japanese | 4.8 /100 | #222 | Tragic 9.9% |
| Immigrants | Africa | 4.3 /100 | #223 | Tragic 9.9% |
| Marshallese | 3.9 /100 | #224 | Tragic 9.9% |