English vs Zimbabwean Receiving Food Stamps
COMPARE
English
Zimbabwean
Receiving Food Stamps
Receiving Food Stamps Comparison
English
Zimbabweans
9.8%
RECEIVING FOOD STAMPS
99.2/ 100
METRIC RATING
61st/ 347
METRIC RANK
9.5%
RECEIVING FOOD STAMPS
99.6/ 100
METRIC RATING
33rd/ 347
METRIC RANK
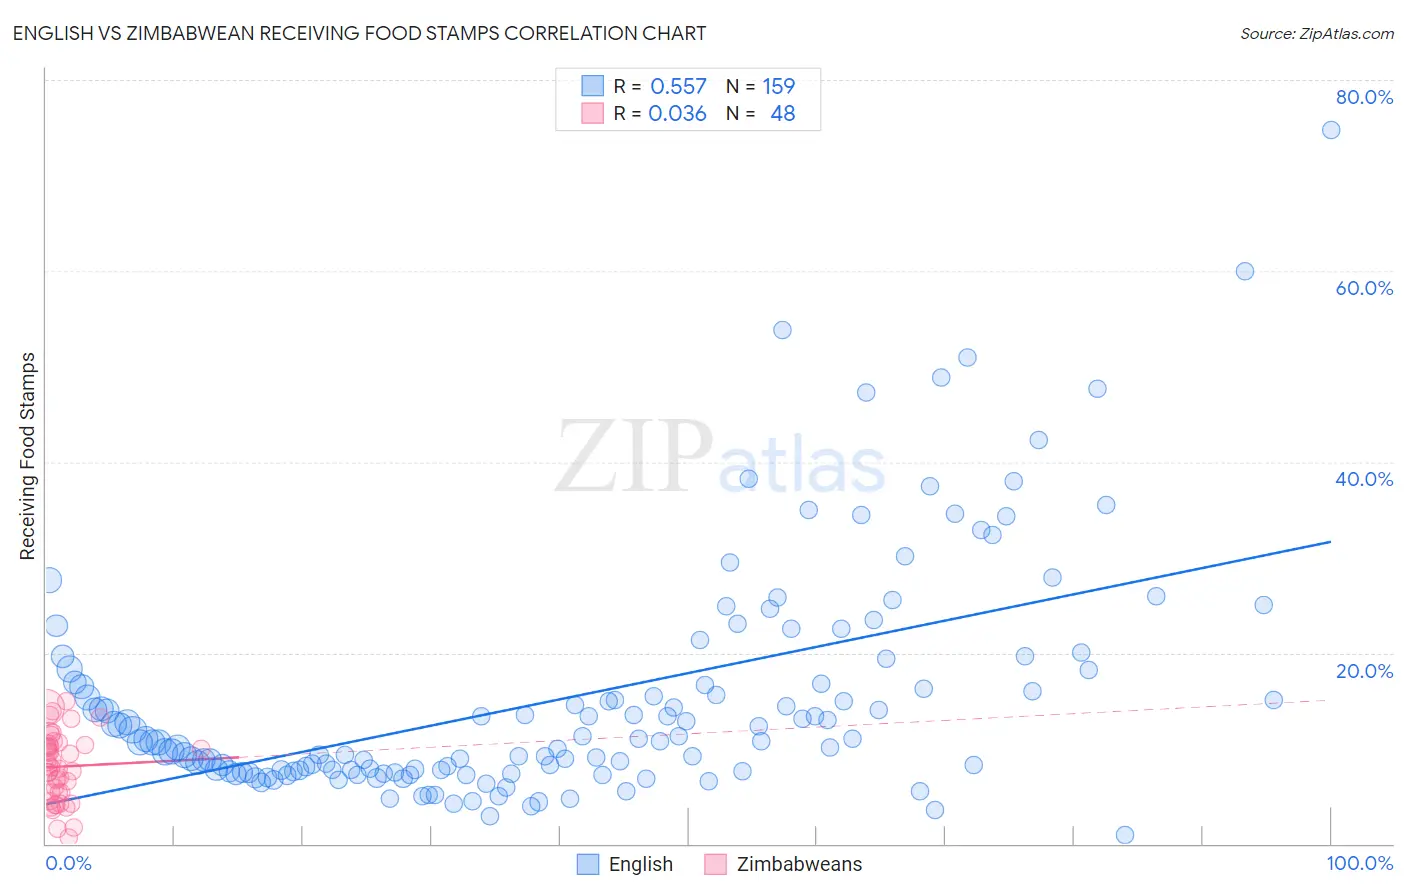
English vs Zimbabwean Receiving Food Stamps Correlation Chart
The statistical analysis conducted on geographies consisting of 575,562,331 people shows a substantial positive correlation between the proportion of English and percentage of population receiving government assistance and/or food stamps in the United States with a correlation coefficient (R) of 0.557 and weighted average of 9.8%. Similarly, the statistical analysis conducted on geographies consisting of 69,180,670 people shows no correlation between the proportion of Zimbabweans and percentage of population receiving government assistance and/or food stamps in the United States with a correlation coefficient (R) of 0.036 and weighted average of 9.5%, a difference of 2.9%.
Receiving Food Stamps Correlation Summary
| Measurement | English | Zimbabwean |
| Minimum | 0.90% | 0.60% |
| Maximum | 74.8% | 14.9% |
| Range | 73.9% | 14.3% |
| Mean | 15.3% | 8.1% |
| Median | 10.8% | 8.1% |
| Interquartile 25% (IQ1) | 7.6% | 5.4% |
| Interquartile 75% (IQ3) | 18.2% | 10.4% |
| Interquartile Range (IQR) | 10.6% | 5.0% |
| Standard Deviation (Sample) | 12.2% | 3.6% |
| Standard Deviation (Population) | 12.1% | 3.5% |
Similar Demographics by Receiving Food Stamps
Demographics Similar to English by Receiving Food Stamps
In terms of receiving food stamps, the demographic groups most similar to English are Immigrants from Bulgaria (9.8%, a difference of 0.080%), Chinese (9.8%, a difference of 0.11%), German (9.7%, a difference of 0.14%), Immigrants from North America (9.8%, a difference of 0.19%), and British (9.7%, a difference of 0.24%).
| Demographics | Rating | Rank | Receiving Food Stamps |
| Swiss | 99.3 /100 | #54 | Exceptional 9.7% |
| Immigrants | Switzerland | 99.3 /100 | #55 | Exceptional 9.7% |
| Immigrants | Canada | 99.3 /100 | #56 | Exceptional 9.7% |
| Greeks | 99.3 /100 | #57 | Exceptional 9.7% |
| Scandinavians | 99.2 /100 | #58 | Exceptional 9.7% |
| British | 99.2 /100 | #59 | Exceptional 9.7% |
| Germans | 99.2 /100 | #60 | Exceptional 9.7% |
| English | 99.2 /100 | #61 | Exceptional 9.8% |
| Immigrants | Bulgaria | 99.2 /100 | #62 | Exceptional 9.8% |
| Chinese | 99.2 /100 | #63 | Exceptional 9.8% |
| Immigrants | North America | 99.2 /100 | #64 | Exceptional 9.8% |
| Immigrants | Turkey | 99.1 /100 | #65 | Exceptional 9.8% |
| Slovenes | 99.1 /100 | #66 | Exceptional 9.8% |
| Immigrants | Indonesia | 99.0 /100 | #67 | Exceptional 9.8% |
| Northern Europeans | 99.0 /100 | #68 | Exceptional 9.8% |
Demographics Similar to Zimbabweans by Receiving Food Stamps
In terms of receiving food stamps, the demographic groups most similar to Zimbabweans are Turkish (9.5%, a difference of 0.010%), Immigrants from Austria (9.5%, a difference of 0.050%), Estonian (9.5%, a difference of 0.070%), European (9.5%, a difference of 0.13%), and Immigrants from Sri Lanka (9.5%, a difference of 0.42%).
| Demographics | Rating | Rank | Receiving Food Stamps |
| Swedes | 99.8 /100 | #26 | Exceptional 9.2% |
| Bhutanese | 99.8 /100 | #27 | Exceptional 9.2% |
| Czechs | 99.8 /100 | #28 | Exceptional 9.2% |
| Immigrants | Lithuania | 99.8 /100 | #29 | Exceptional 9.2% |
| Immigrants | Sweden | 99.7 /100 | #30 | Exceptional 9.3% |
| Immigrants | Eastern Asia | 99.7 /100 | #31 | Exceptional 9.3% |
| Bolivians | 99.7 /100 | #32 | Exceptional 9.3% |
| Zimbabweans | 99.6 /100 | #33 | Exceptional 9.5% |
| Turks | 99.6 /100 | #34 | Exceptional 9.5% |
| Immigrants | Austria | 99.6 /100 | #35 | Exceptional 9.5% |
| Estonians | 99.6 /100 | #36 | Exceptional 9.5% |
| Europeans | 99.6 /100 | #37 | Exceptional 9.5% |
| Immigrants | Sri Lanka | 99.5 /100 | #38 | Exceptional 9.5% |
| Immigrants | Bolivia | 99.5 /100 | #39 | Exceptional 9.5% |
| Immigrants | Netherlands | 99.5 /100 | #40 | Exceptional 9.5% |