Cuban vs Zimbabwean Receiving Food Stamps
COMPARE
Cuban
Zimbabwean
Receiving Food Stamps
Receiving Food Stamps Comparison
Cubans
Zimbabweans
18.2%
RECEIVING FOOD STAMPS
0.0/ 100
METRIC RATING
326th/ 347
METRIC RANK
9.5%
RECEIVING FOOD STAMPS
99.6/ 100
METRIC RATING
33rd/ 347
METRIC RANK
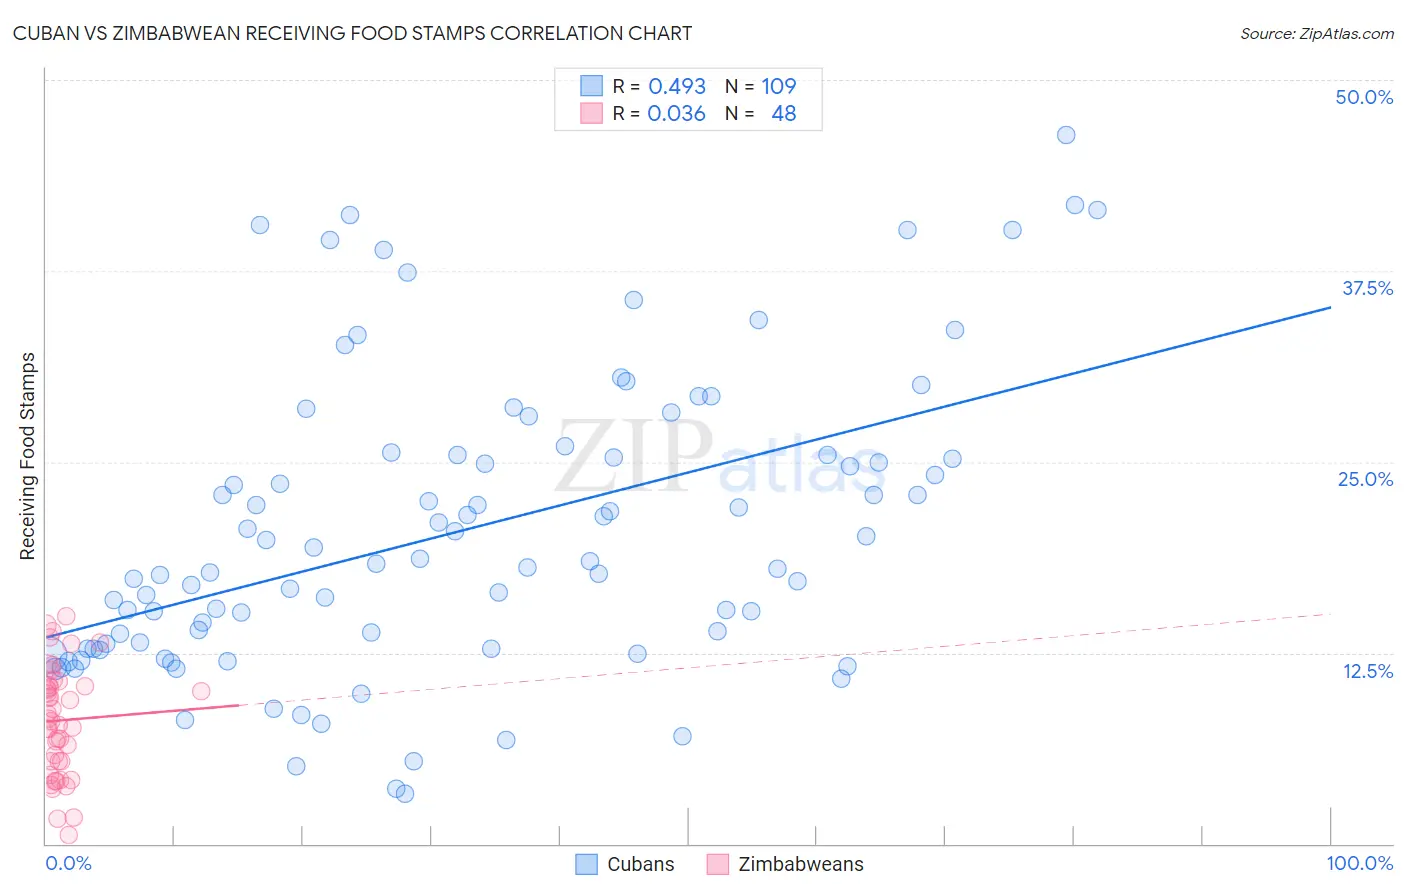
Cuban vs Zimbabwean Receiving Food Stamps Correlation Chart
The statistical analysis conducted on geographies consisting of 447,765,470 people shows a moderate positive correlation between the proportion of Cubans and percentage of population receiving government assistance and/or food stamps in the United States with a correlation coefficient (R) of 0.493 and weighted average of 18.2%. Similarly, the statistical analysis conducted on geographies consisting of 69,180,670 people shows no correlation between the proportion of Zimbabweans and percentage of population receiving government assistance and/or food stamps in the United States with a correlation coefficient (R) of 0.036 and weighted average of 9.5%, a difference of 92.2%.
Receiving Food Stamps Correlation Summary
| Measurement | Cuban | Zimbabwean |
| Minimum | 3.3% | 0.60% |
| Maximum | 46.4% | 14.9% |
| Range | 43.1% | 14.3% |
| Mean | 20.4% | 8.1% |
| Median | 18.3% | 8.1% |
| Interquartile 25% (IQ1) | 12.8% | 5.4% |
| Interquartile 75% (IQ3) | 25.5% | 10.4% |
| Interquartile Range (IQR) | 12.7% | 5.0% |
| Standard Deviation (Sample) | 9.6% | 3.6% |
| Standard Deviation (Population) | 9.6% | 3.5% |
Similar Demographics by Receiving Food Stamps
Demographics Similar to Cubans by Receiving Food Stamps
In terms of receiving food stamps, the demographic groups most similar to Cubans are Immigrants from Haiti (18.2%, a difference of 0.11%), Apache (18.3%, a difference of 0.31%), Colville (18.3%, a difference of 0.52%), Immigrants from Dominica (18.4%, a difference of 0.98%), and British West Indian (17.9%, a difference of 1.9%).
| Demographics | Rating | Rank | Receiving Food Stamps |
| Immigrants | St. Vincent and the Grenadines | 0.0 /100 | #319 | Tragic 17.2% |
| Immigrants | Nicaragua | 0.0 /100 | #320 | Tragic 17.2% |
| Natives/Alaskans | 0.0 /100 | #321 | Tragic 17.3% |
| Immigrants | Grenada | 0.0 /100 | #322 | Tragic 17.8% |
| Haitians | 0.0 /100 | #323 | Tragic 17.8% |
| British West Indians | 0.0 /100 | #324 | Tragic 17.9% |
| Immigrants | Haiti | 0.0 /100 | #325 | Tragic 18.2% |
| Cubans | 0.0 /100 | #326 | Tragic 18.2% |
| Apache | 0.0 /100 | #327 | Tragic 18.3% |
| Colville | 0.0 /100 | #328 | Tragic 18.3% |
| Immigrants | Dominica | 0.0 /100 | #329 | Tragic 18.4% |
| Pima | 0.0 /100 | #330 | Tragic 19.0% |
| Immigrants | Caribbean | 0.0 /100 | #331 | Tragic 19.6% |
| Pueblo | 0.0 /100 | #332 | Tragic 19.9% |
| Inupiat | 0.0 /100 | #333 | Tragic 20.1% |
Demographics Similar to Zimbabweans by Receiving Food Stamps
In terms of receiving food stamps, the demographic groups most similar to Zimbabweans are Turkish (9.5%, a difference of 0.010%), Immigrants from Austria (9.5%, a difference of 0.050%), Estonian (9.5%, a difference of 0.070%), European (9.5%, a difference of 0.13%), and Immigrants from Sri Lanka (9.5%, a difference of 0.42%).
| Demographics | Rating | Rank | Receiving Food Stamps |
| Swedes | 99.8 /100 | #26 | Exceptional 9.2% |
| Bhutanese | 99.8 /100 | #27 | Exceptional 9.2% |
| Czechs | 99.8 /100 | #28 | Exceptional 9.2% |
| Immigrants | Lithuania | 99.8 /100 | #29 | Exceptional 9.2% |
| Immigrants | Sweden | 99.7 /100 | #30 | Exceptional 9.3% |
| Immigrants | Eastern Asia | 99.7 /100 | #31 | Exceptional 9.3% |
| Bolivians | 99.7 /100 | #32 | Exceptional 9.3% |
| Zimbabweans | 99.6 /100 | #33 | Exceptional 9.5% |
| Turks | 99.6 /100 | #34 | Exceptional 9.5% |
| Immigrants | Austria | 99.6 /100 | #35 | Exceptional 9.5% |
| Estonians | 99.6 /100 | #36 | Exceptional 9.5% |
| Europeans | 99.6 /100 | #37 | Exceptional 9.5% |
| Immigrants | Sri Lanka | 99.5 /100 | #38 | Exceptional 9.5% |
| Immigrants | Bolivia | 99.5 /100 | #39 | Exceptional 9.5% |
| Immigrants | Netherlands | 99.5 /100 | #40 | Exceptional 9.5% |