English vs New Zealander Single Male Poverty
COMPARE
English
New Zealander
Single Male Poverty
Single Male Poverty Comparison
English
New Zealanders
14.1%
SINGLE MALE POVERTY
0.1/ 100
METRIC RATING
275th/ 347
METRIC RANK
13.2%
SINGLE MALE POVERTY
10.7/ 100
METRIC RATING
221st/ 347
METRIC RANK
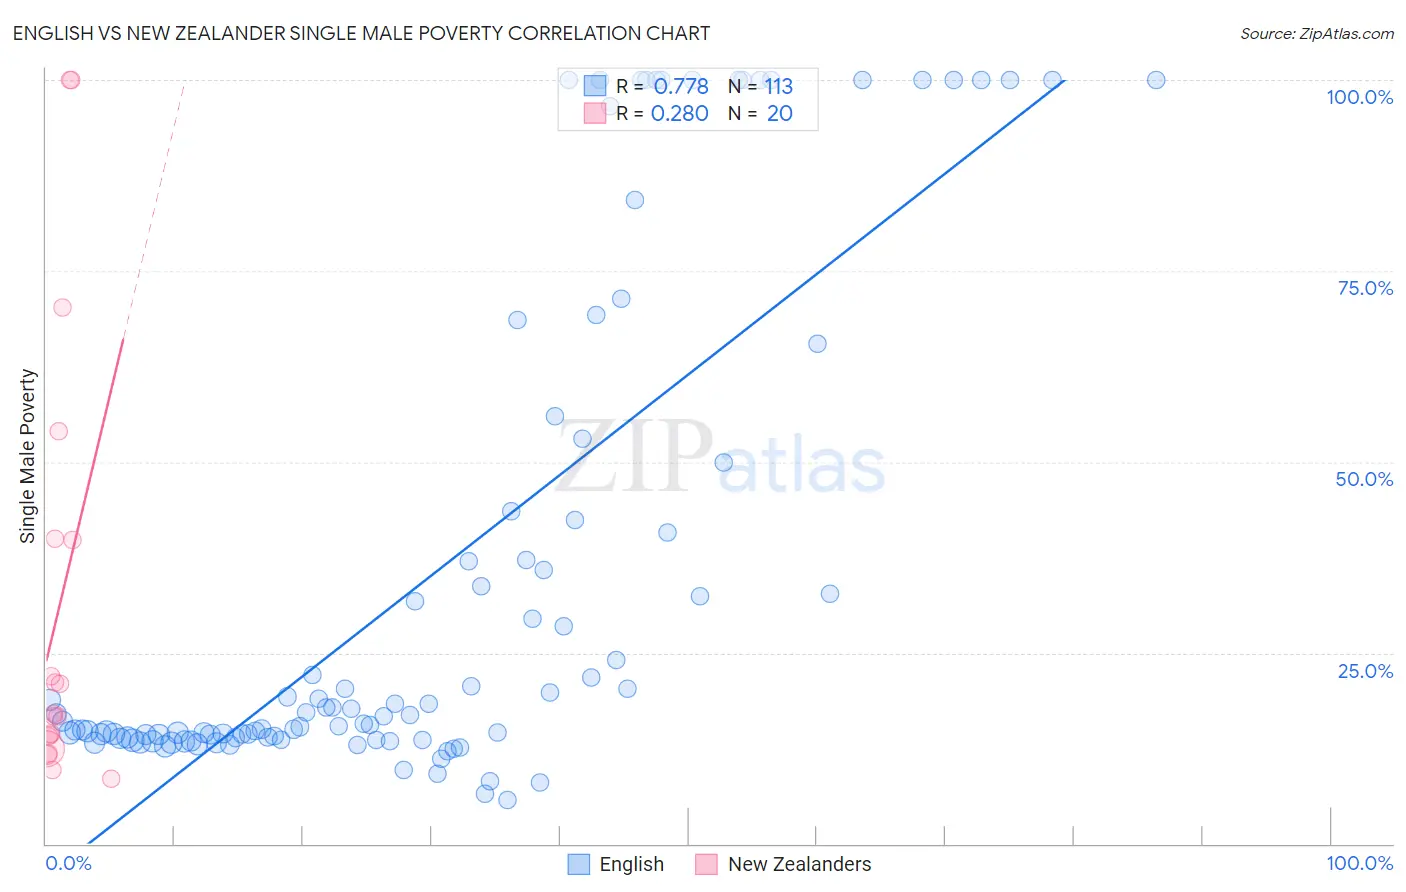
English vs New Zealander Single Male Poverty Correlation Chart
The statistical analysis conducted on geographies consisting of 475,099,877 people shows a strong positive correlation between the proportion of English and poverty level among single males in the United States with a correlation coefficient (R) of 0.778 and weighted average of 14.1%. Similarly, the statistical analysis conducted on geographies consisting of 101,681,215 people shows a weak positive correlation between the proportion of New Zealanders and poverty level among single males in the United States with a correlation coefficient (R) of 0.280 and weighted average of 13.2%, a difference of 6.9%.
Single Male Poverty Correlation Summary
| Measurement | English | New Zealander |
| Minimum | 5.8% | 8.6% |
| Maximum | 100.0% | 100.0% |
| Range | 94.2% | 91.4% |
| Mean | 34.8% | 30.8% |
| Median | 16.8% | 16.9% |
| Interquartile 25% (IQ1) | 13.9% | 13.3% |
| Interquartile 75% (IQ3) | 43.0% | 39.9% |
| Interquartile Range (IQR) | 29.1% | 26.6% |
| Standard Deviation (Sample) | 32.6% | 28.6% |
| Standard Deviation (Population) | 32.5% | 27.9% |
Similar Demographics by Single Male Poverty
Demographics Similar to English by Single Male Poverty
In terms of single male poverty, the demographic groups most similar to English are Honduran (14.0%, a difference of 0.080%), Dutch (14.1%, a difference of 0.12%), Immigrants from Honduras (14.1%, a difference of 0.16%), Welsh (14.0%, a difference of 0.21%), and Slovak (14.1%, a difference of 0.22%).
| Demographics | Rating | Rank | Single Male Poverty |
| Immigrants | Mexico | 0.1 /100 | #268 | Tragic 13.9% |
| Scottish | 0.1 /100 | #269 | Tragic 14.0% |
| Immigrants | Saudi Arabia | 0.1 /100 | #270 | Tragic 14.0% |
| Irish | 0.1 /100 | #271 | Tragic 14.0% |
| Mexicans | 0.1 /100 | #272 | Tragic 14.0% |
| Welsh | 0.1 /100 | #273 | Tragic 14.0% |
| Hondurans | 0.1 /100 | #274 | Tragic 14.0% |
| English | 0.1 /100 | #275 | Tragic 14.1% |
| Dutch | 0.1 /100 | #276 | Tragic 14.1% |
| Immigrants | Honduras | 0.0 /100 | #277 | Tragic 14.1% |
| Slovaks | 0.0 /100 | #278 | Tragic 14.1% |
| Indonesians | 0.0 /100 | #279 | Tragic 14.1% |
| Hmong | 0.0 /100 | #280 | Tragic 14.2% |
| Hispanics or Latinos | 0.0 /100 | #281 | Tragic 14.2% |
| Spanish Americans | 0.0 /100 | #282 | Tragic 14.2% |
Demographics Similar to New Zealanders by Single Male Poverty
In terms of single male poverty, the demographic groups most similar to New Zealanders are Central American (13.2%, a difference of 0.020%), Immigrants from Western Europe (13.2%, a difference of 0.090%), Immigrants from the Azores (13.2%, a difference of 0.20%), Immigrants from Burma/Myanmar (13.1%, a difference of 0.24%), and Somali (13.2%, a difference of 0.24%).
| Demographics | Rating | Rank | Single Male Poverty |
| Zimbabweans | 14.9 /100 | #214 | Poor 13.1% |
| Japanese | 14.8 /100 | #215 | Poor 13.1% |
| Austrians | 13.9 /100 | #216 | Poor 13.1% |
| Bermudans | 13.0 /100 | #217 | Poor 13.1% |
| Scandinavians | 12.9 /100 | #218 | Poor 13.1% |
| Immigrants | Burma/Myanmar | 12.6 /100 | #219 | Poor 13.1% |
| Central Americans | 10.9 /100 | #220 | Poor 13.2% |
| New Zealanders | 10.7 /100 | #221 | Poor 13.2% |
| Immigrants | Western Europe | 10.0 /100 | #222 | Poor 13.2% |
| Immigrants | Azores | 9.3 /100 | #223 | Tragic 13.2% |
| Somalis | 9.1 /100 | #224 | Tragic 13.2% |
| Immigrants | Denmark | 8.7 /100 | #225 | Tragic 13.2% |
| Jamaicans | 7.7 /100 | #226 | Tragic 13.2% |
| Haitians | 7.0 /100 | #227 | Tragic 13.2% |
| Lebanese | 6.6 /100 | #228 | Tragic 13.2% |