English vs Immigrants from Uruguay Single Male Poverty
COMPARE
English
Immigrants from Uruguay
Single Male Poverty
Single Male Poverty Comparison
English
Immigrants from Uruguay
14.1%
SINGLE MALE POVERTY
0.1/ 100
METRIC RATING
275th/ 347
METRIC RANK
11.9%
SINGLE MALE POVERTY
99.6/ 100
METRIC RATING
66th/ 347
METRIC RANK
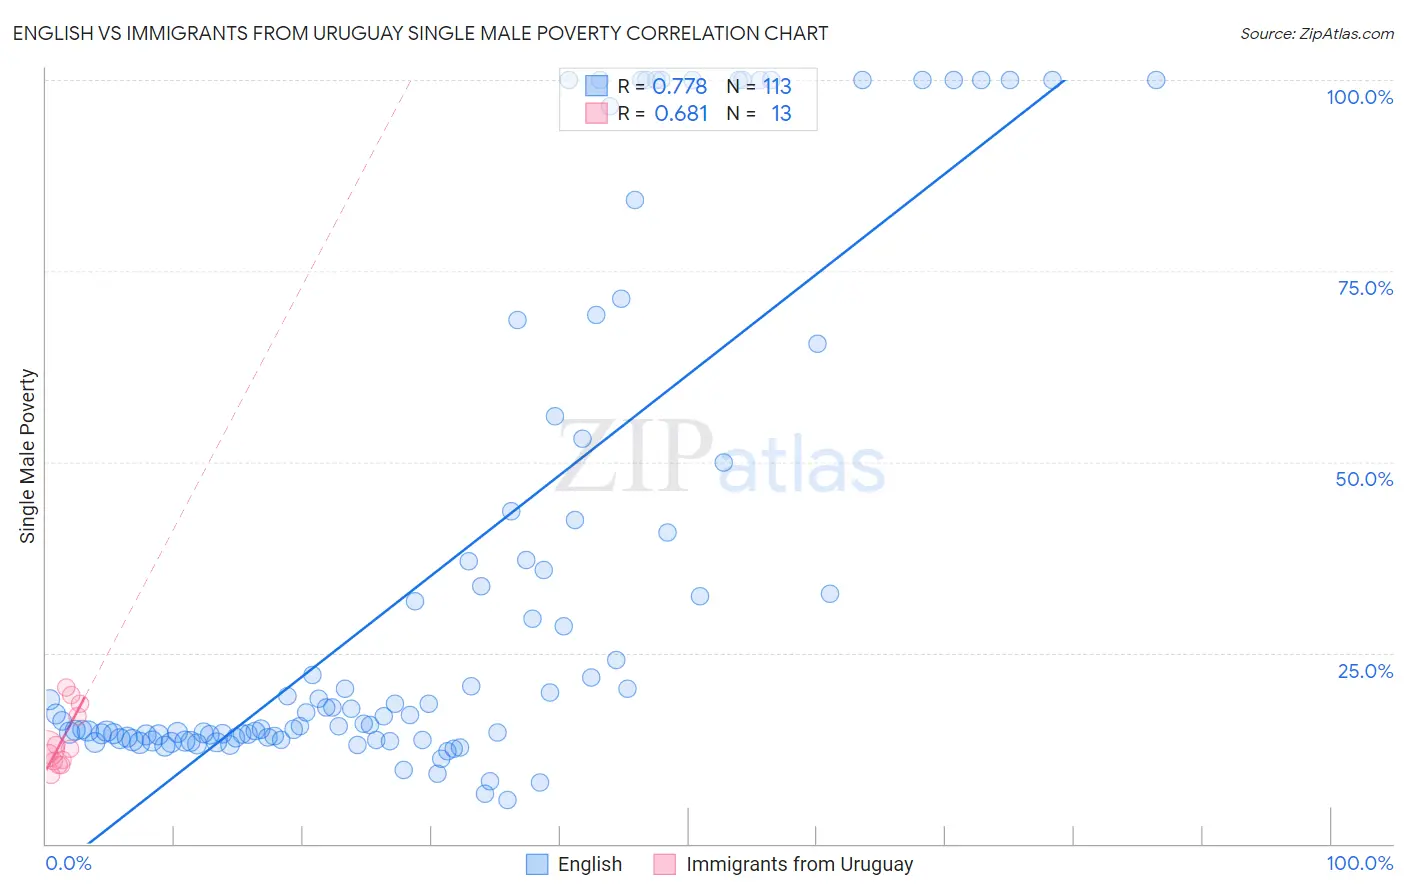
English vs Immigrants from Uruguay Single Male Poverty Correlation Chart
The statistical analysis conducted on geographies consisting of 475,099,877 people shows a strong positive correlation between the proportion of English and poverty level among single males in the United States with a correlation coefficient (R) of 0.778 and weighted average of 14.1%. Similarly, the statistical analysis conducted on geographies consisting of 126,342,456 people shows a significant positive correlation between the proportion of Immigrants from Uruguay and poverty level among single males in the United States with a correlation coefficient (R) of 0.681 and weighted average of 11.9%, a difference of 18.6%.
Single Male Poverty Correlation Summary
| Measurement | English | Immigrants from Uruguay |
| Minimum | 5.8% | 9.1% |
| Maximum | 100.0% | 20.5% |
| Range | 94.2% | 11.5% |
| Mean | 34.8% | 13.6% |
| Median | 16.8% | 12.4% |
| Interquartile 25% (IQ1) | 13.9% | 10.6% |
| Interquartile 75% (IQ3) | 43.0% | 17.5% |
| Interquartile Range (IQR) | 29.1% | 6.9% |
| Standard Deviation (Sample) | 32.6% | 3.8% |
| Standard Deviation (Population) | 32.5% | 3.7% |
Similar Demographics by Single Male Poverty
Demographics Similar to English by Single Male Poverty
In terms of single male poverty, the demographic groups most similar to English are Honduran (14.0%, a difference of 0.080%), Dutch (14.1%, a difference of 0.12%), Immigrants from Honduras (14.1%, a difference of 0.16%), Welsh (14.0%, a difference of 0.21%), and Slovak (14.1%, a difference of 0.22%).
| Demographics | Rating | Rank | Single Male Poverty |
| Immigrants | Mexico | 0.1 /100 | #268 | Tragic 13.9% |
| Scottish | 0.1 /100 | #269 | Tragic 14.0% |
| Immigrants | Saudi Arabia | 0.1 /100 | #270 | Tragic 14.0% |
| Irish | 0.1 /100 | #271 | Tragic 14.0% |
| Mexicans | 0.1 /100 | #272 | Tragic 14.0% |
| Welsh | 0.1 /100 | #273 | Tragic 14.0% |
| Hondurans | 0.1 /100 | #274 | Tragic 14.0% |
| English | 0.1 /100 | #275 | Tragic 14.1% |
| Dutch | 0.1 /100 | #276 | Tragic 14.1% |
| Immigrants | Honduras | 0.0 /100 | #277 | Tragic 14.1% |
| Slovaks | 0.0 /100 | #278 | Tragic 14.1% |
| Indonesians | 0.0 /100 | #279 | Tragic 14.1% |
| Hmong | 0.0 /100 | #280 | Tragic 14.2% |
| Hispanics or Latinos | 0.0 /100 | #281 | Tragic 14.2% |
| Spanish Americans | 0.0 /100 | #282 | Tragic 14.2% |
Demographics Similar to Immigrants from Uruguay by Single Male Poverty
In terms of single male poverty, the demographic groups most similar to Immigrants from Uruguay are Laotian (11.9%, a difference of 0.0%), Immigrants from Ukraine (11.9%, a difference of 0.020%), Immigrants from Croatia (11.9%, a difference of 0.030%), Immigrants from Russia (11.9%, a difference of 0.060%), and Immigrants from Nepal (11.9%, a difference of 0.080%).
| Demographics | Rating | Rank | Single Male Poverty |
| Brazilians | 99.8 /100 | #59 | Exceptional 11.8% |
| Peruvians | 99.8 /100 | #60 | Exceptional 11.8% |
| Cambodians | 99.8 /100 | #61 | Exceptional 11.8% |
| Immigrants | Sri Lanka | 99.7 /100 | #62 | Exceptional 11.8% |
| Immigrants | Belarus | 99.7 /100 | #63 | Exceptional 11.8% |
| Immigrants | Eastern Europe | 99.6 /100 | #64 | Exceptional 11.8% |
| Laotians | 99.6 /100 | #65 | Exceptional 11.9% |
| Immigrants | Uruguay | 99.6 /100 | #66 | Exceptional 11.9% |
| Immigrants | Ukraine | 99.6 /100 | #67 | Exceptional 11.9% |
| Immigrants | Croatia | 99.6 /100 | #68 | Exceptional 11.9% |
| Immigrants | Russia | 99.6 /100 | #69 | Exceptional 11.9% |
| Immigrants | Nepal | 99.6 /100 | #70 | Exceptional 11.9% |
| Immigrants | Greece | 99.6 /100 | #71 | Exceptional 11.9% |
| Immigrants | Argentina | 99.5 /100 | #72 | Exceptional 11.9% |
| Argentineans | 99.5 /100 | #73 | Exceptional 11.9% |