English vs Immigrants from Switzerland Single Male Poverty
COMPARE
English
Immigrants from Switzerland
Single Male Poverty
Single Male Poverty Comparison
English
Immigrants from Switzerland
14.1%
SINGLE MALE POVERTY
0.1/ 100
METRIC RATING
275th/ 347
METRIC RANK
12.8%
SINGLE MALE POVERTY
43.1/ 100
METRIC RATING
178th/ 347
METRIC RANK
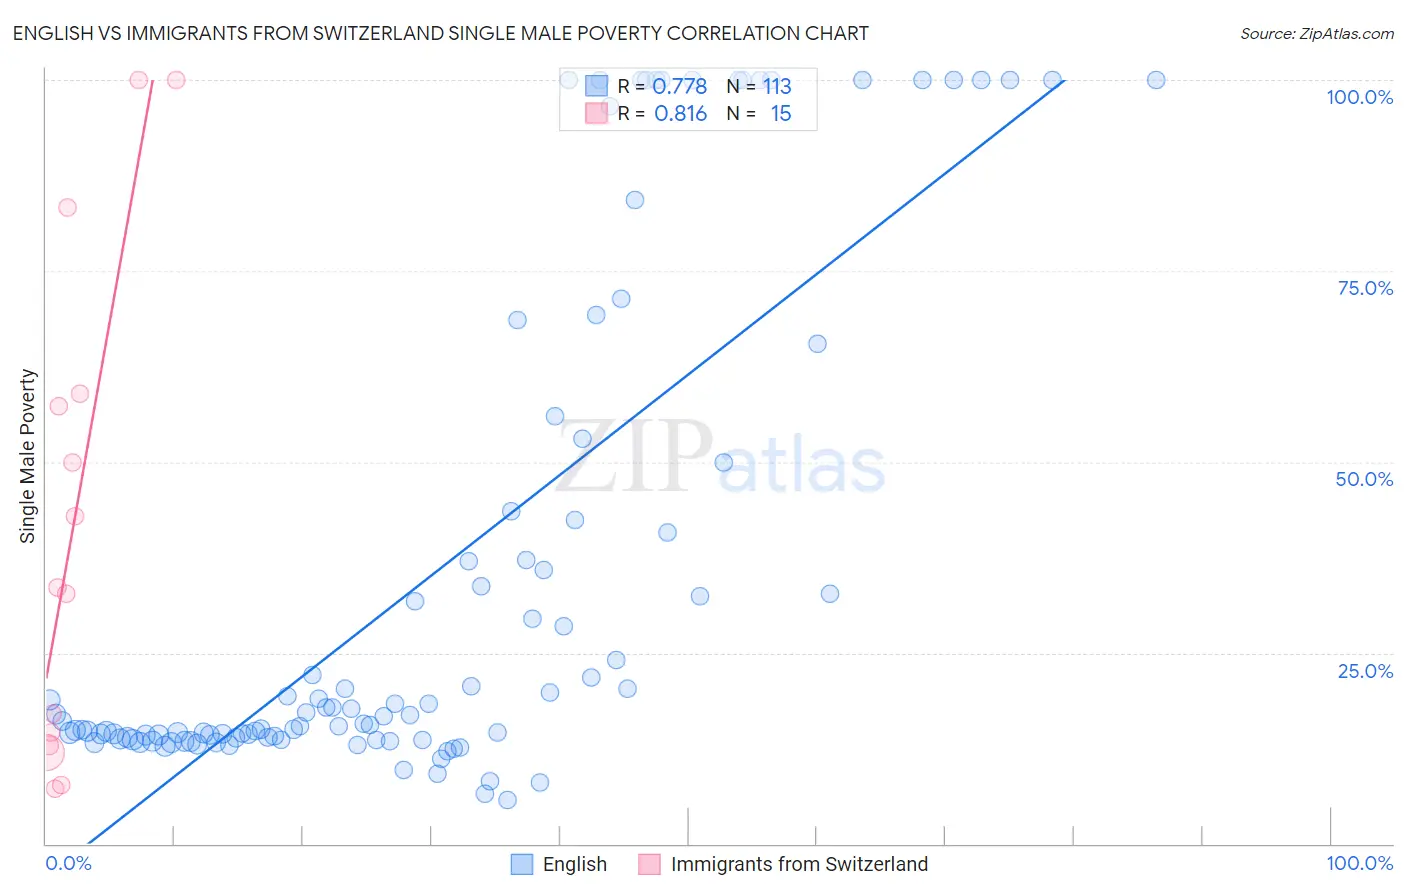
English vs Immigrants from Switzerland Single Male Poverty Correlation Chart
The statistical analysis conducted on geographies consisting of 475,099,877 people shows a strong positive correlation between the proportion of English and poverty level among single males in the United States with a correlation coefficient (R) of 0.778 and weighted average of 14.1%. Similarly, the statistical analysis conducted on geographies consisting of 136,371,687 people shows a very strong positive correlation between the proportion of Immigrants from Switzerland and poverty level among single males in the United States with a correlation coefficient (R) of 0.816 and weighted average of 12.8%, a difference of 9.5%.
Single Male Poverty Correlation Summary
| Measurement | English | Immigrants from Switzerland |
| Minimum | 5.8% | 7.2% |
| Maximum | 100.0% | 100.0% |
| Range | 94.2% | 92.8% |
| Mean | 34.8% | 42.0% |
| Median | 16.8% | 33.6% |
| Interquartile 25% (IQ1) | 13.9% | 12.9% |
| Interquartile 75% (IQ3) | 43.0% | 58.9% |
| Interquartile Range (IQR) | 29.1% | 46.0% |
| Standard Deviation (Sample) | 32.6% | 32.4% |
| Standard Deviation (Population) | 32.5% | 31.3% |
Similar Demographics by Single Male Poverty
Demographics Similar to English by Single Male Poverty
In terms of single male poverty, the demographic groups most similar to English are Honduran (14.0%, a difference of 0.080%), Dutch (14.1%, a difference of 0.12%), Immigrants from Honduras (14.1%, a difference of 0.16%), Welsh (14.0%, a difference of 0.21%), and Slovak (14.1%, a difference of 0.22%).
| Demographics | Rating | Rank | Single Male Poverty |
| Immigrants | Mexico | 0.1 /100 | #268 | Tragic 13.9% |
| Scottish | 0.1 /100 | #269 | Tragic 14.0% |
| Immigrants | Saudi Arabia | 0.1 /100 | #270 | Tragic 14.0% |
| Irish | 0.1 /100 | #271 | Tragic 14.0% |
| Mexicans | 0.1 /100 | #272 | Tragic 14.0% |
| Welsh | 0.1 /100 | #273 | Tragic 14.0% |
| Hondurans | 0.1 /100 | #274 | Tragic 14.0% |
| English | 0.1 /100 | #275 | Tragic 14.1% |
| Dutch | 0.1 /100 | #276 | Tragic 14.1% |
| Immigrants | Honduras | 0.0 /100 | #277 | Tragic 14.1% |
| Slovaks | 0.0 /100 | #278 | Tragic 14.1% |
| Indonesians | 0.0 /100 | #279 | Tragic 14.1% |
| Hmong | 0.0 /100 | #280 | Tragic 14.2% |
| Hispanics or Latinos | 0.0 /100 | #281 | Tragic 14.2% |
| Spanish Americans | 0.0 /100 | #282 | Tragic 14.2% |
Demographics Similar to Immigrants from Switzerland by Single Male Poverty
In terms of single male poverty, the demographic groups most similar to Immigrants from Switzerland are Immigrants from Canada (12.8%, a difference of 0.090%), Israeli (12.9%, a difference of 0.11%), Syrian (12.8%, a difference of 0.28%), Immigrants from North America (12.9%, a difference of 0.29%), and Panamanian (12.9%, a difference of 0.30%).
| Demographics | Rating | Rank | Single Male Poverty |
| South Africans | 51.5 /100 | #171 | Average 12.8% |
| Danes | 51.4 /100 | #172 | Average 12.8% |
| Immigrants | St. Vincent and the Grenadines | 50.9 /100 | #173 | Average 12.8% |
| Costa Ricans | 50.0 /100 | #174 | Average 12.8% |
| Croatians | 48.9 /100 | #175 | Average 12.8% |
| Syrians | 48.4 /100 | #176 | Average 12.8% |
| Immigrants | Canada | 44.8 /100 | #177 | Average 12.8% |
| Immigrants | Switzerland | 43.1 /100 | #178 | Average 12.8% |
| Israelis | 41.0 /100 | #179 | Average 12.9% |
| Immigrants | North America | 37.7 /100 | #180 | Fair 12.9% |
| Panamanians | 37.6 /100 | #181 | Fair 12.9% |
| Moroccans | 36.8 /100 | #182 | Fair 12.9% |
| Immigrants | West Indies | 33.0 /100 | #183 | Fair 12.9% |
| Immigrants | Trinidad and Tobago | 32.5 /100 | #184 | Fair 12.9% |
| Norwegians | 32.0 /100 | #185 | Fair 12.9% |