Shoshone vs Immigrants from Uruguay Single Male Poverty
COMPARE
Shoshone
Immigrants from Uruguay
Single Male Poverty
Single Male Poverty Comparison
Shoshone
Immigrants from Uruguay
16.7%
SINGLE MALE POVERTY
0.0/ 100
METRIC RATING
322nd/ 347
METRIC RANK
11.9%
SINGLE MALE POVERTY
99.6/ 100
METRIC RATING
66th/ 347
METRIC RANK
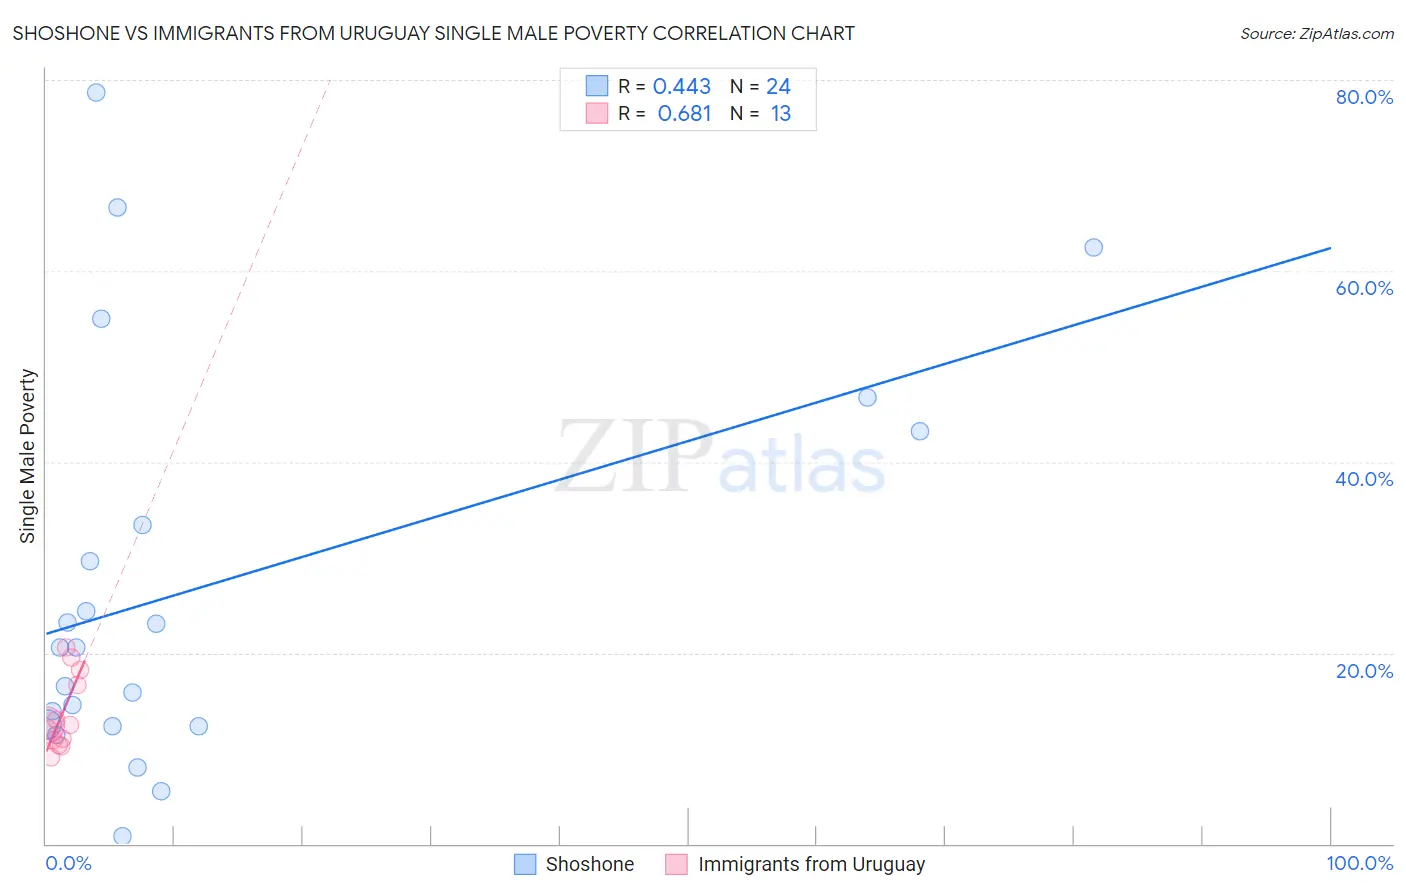
Shoshone vs Immigrants from Uruguay Single Male Poverty Correlation Chart
The statistical analysis conducted on geographies consisting of 64,727,315 people shows a moderate positive correlation between the proportion of Shoshone and poverty level among single males in the United States with a correlation coefficient (R) of 0.443 and weighted average of 16.7%. Similarly, the statistical analysis conducted on geographies consisting of 126,342,456 people shows a significant positive correlation between the proportion of Immigrants from Uruguay and poverty level among single males in the United States with a correlation coefficient (R) of 0.681 and weighted average of 11.9%, a difference of 40.6%.
Single Male Poverty Correlation Summary
| Measurement | Shoshone | Immigrants from Uruguay |
| Minimum | 0.78% | 9.1% |
| Maximum | 78.7% | 20.5% |
| Range | 77.9% | 11.5% |
| Mean | 27.1% | 13.6% |
| Median | 20.6% | 12.4% |
| Interquartile 25% (IQ1) | 12.4% | 10.6% |
| Interquartile 75% (IQ3) | 38.3% | 17.5% |
| Interquartile Range (IQR) | 25.9% | 6.9% |
| Standard Deviation (Sample) | 20.9% | 3.8% |
| Standard Deviation (Population) | 20.5% | 3.7% |
Similar Demographics by Single Male Poverty
Demographics Similar to Shoshone by Single Male Poverty
In terms of single male poverty, the demographic groups most similar to Shoshone are Creek (16.8%, a difference of 1.0%), Immigrants from Yemen (16.9%, a difference of 1.1%), Osage (16.5%, a difference of 1.3%), Marshallese (16.4%, a difference of 1.4%), and Chippewa (16.4%, a difference of 1.9%).
| Demographics | Rating | Rank | Single Male Poverty |
| Cheyenne | 0.0 /100 | #315 | Tragic 16.1% |
| Dutch West Indians | 0.0 /100 | #316 | Tragic 16.1% |
| Blacks/African Americans | 0.0 /100 | #317 | Tragic 16.2% |
| Chickasaw | 0.0 /100 | #318 | Tragic 16.3% |
| Chippewa | 0.0 /100 | #319 | Tragic 16.4% |
| Marshallese | 0.0 /100 | #320 | Tragic 16.4% |
| Osage | 0.0 /100 | #321 | Tragic 16.5% |
| Shoshone | 0.0 /100 | #322 | Tragic 16.7% |
| Creek | 0.0 /100 | #323 | Tragic 16.8% |
| Immigrants | Yemen | 0.0 /100 | #324 | Tragic 16.9% |
| Choctaw | 0.0 /100 | #325 | Tragic 17.0% |
| Central American Indians | 0.0 /100 | #326 | Tragic 17.2% |
| Menominee | 0.0 /100 | #327 | Tragic 17.7% |
| Kiowa | 0.0 /100 | #328 | Tragic 18.3% |
| Colville | 0.0 /100 | #329 | Tragic 18.4% |
Demographics Similar to Immigrants from Uruguay by Single Male Poverty
In terms of single male poverty, the demographic groups most similar to Immigrants from Uruguay are Laotian (11.9%, a difference of 0.0%), Immigrants from Ukraine (11.9%, a difference of 0.020%), Immigrants from Croatia (11.9%, a difference of 0.030%), Immigrants from Russia (11.9%, a difference of 0.060%), and Immigrants from Nepal (11.9%, a difference of 0.080%).
| Demographics | Rating | Rank | Single Male Poverty |
| Brazilians | 99.8 /100 | #59 | Exceptional 11.8% |
| Peruvians | 99.8 /100 | #60 | Exceptional 11.8% |
| Cambodians | 99.8 /100 | #61 | Exceptional 11.8% |
| Immigrants | Sri Lanka | 99.7 /100 | #62 | Exceptional 11.8% |
| Immigrants | Belarus | 99.7 /100 | #63 | Exceptional 11.8% |
| Immigrants | Eastern Europe | 99.6 /100 | #64 | Exceptional 11.8% |
| Laotians | 99.6 /100 | #65 | Exceptional 11.9% |
| Immigrants | Uruguay | 99.6 /100 | #66 | Exceptional 11.9% |
| Immigrants | Ukraine | 99.6 /100 | #67 | Exceptional 11.9% |
| Immigrants | Croatia | 99.6 /100 | #68 | Exceptional 11.9% |
| Immigrants | Russia | 99.6 /100 | #69 | Exceptional 11.9% |
| Immigrants | Nepal | 99.6 /100 | #70 | Exceptional 11.9% |
| Immigrants | Greece | 99.6 /100 | #71 | Exceptional 11.9% |
| Immigrants | Argentina | 99.5 /100 | #72 | Exceptional 11.9% |
| Argentineans | 99.5 /100 | #73 | Exceptional 11.9% |