Pakistani vs Immigrants from Switzerland Single Male Poverty
COMPARE
Pakistani
Immigrants from Switzerland
Single Male Poverty
Single Male Poverty Comparison
Pakistanis
Immigrants from Switzerland
12.4%
SINGLE MALE POVERTY
92.4/ 100
METRIC RATING
113th/ 347
METRIC RANK
12.8%
SINGLE MALE POVERTY
43.1/ 100
METRIC RATING
178th/ 347
METRIC RANK
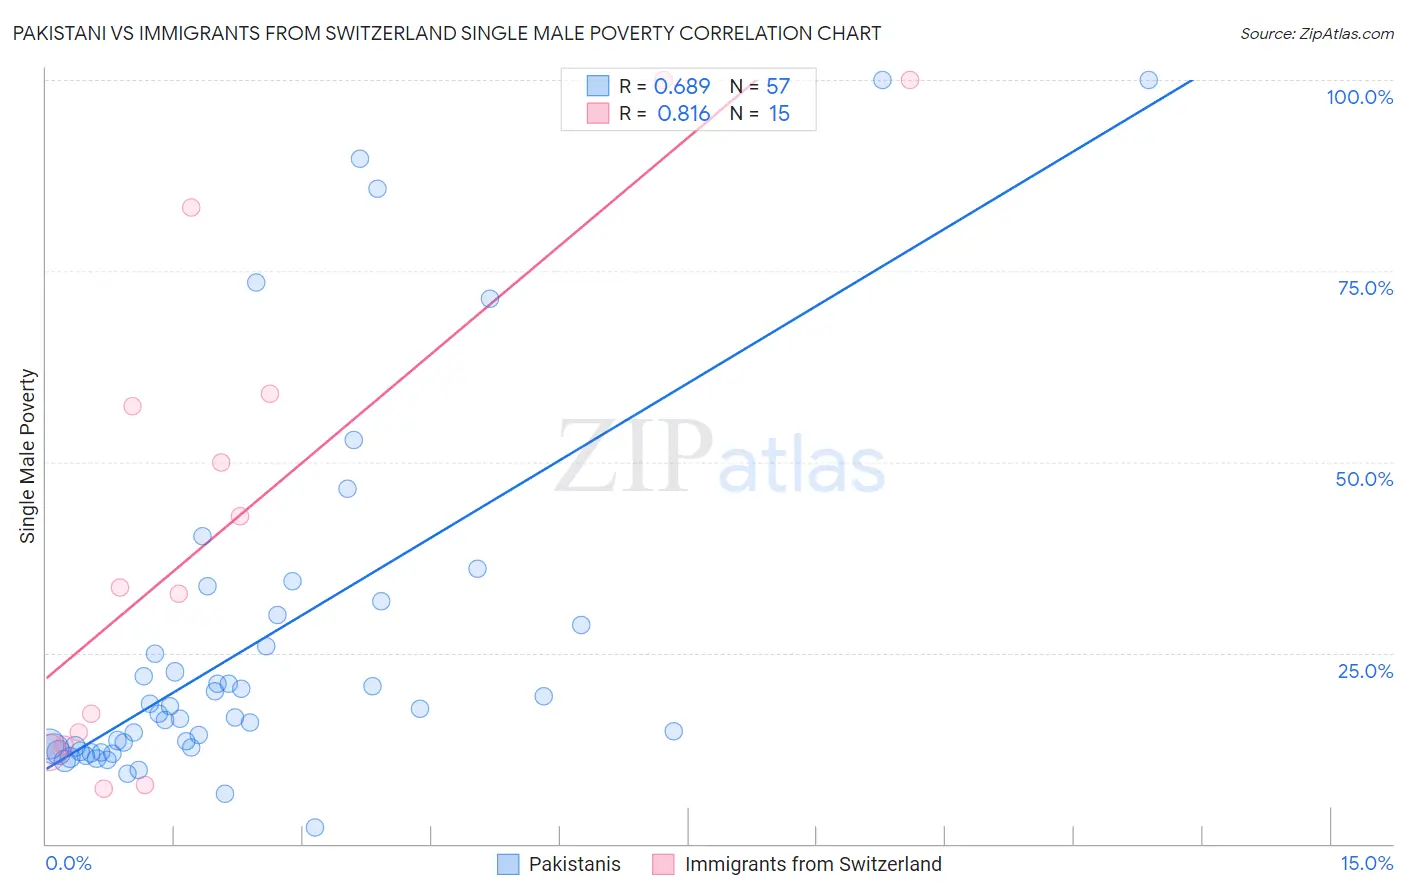
Pakistani vs Immigrants from Switzerland Single Male Poverty Correlation Chart
The statistical analysis conducted on geographies consisting of 304,084,454 people shows a significant positive correlation between the proportion of Pakistanis and poverty level among single males in the United States with a correlation coefficient (R) of 0.689 and weighted average of 12.4%. Similarly, the statistical analysis conducted on geographies consisting of 136,371,687 people shows a very strong positive correlation between the proportion of Immigrants from Switzerland and poverty level among single males in the United States with a correlation coefficient (R) of 0.816 and weighted average of 12.8%, a difference of 3.8%.
Single Male Poverty Correlation Summary
| Measurement | Pakistani | Immigrants from Switzerland |
| Minimum | 2.1% | 7.2% |
| Maximum | 100.0% | 100.0% |
| Range | 97.9% | 92.8% |
| Mean | 26.1% | 42.0% |
| Median | 17.0% | 33.6% |
| Interquartile 25% (IQ1) | 12.3% | 12.9% |
| Interquartile 75% (IQ3) | 29.3% | 58.9% |
| Interquartile Range (IQR) | 17.0% | 46.0% |
| Standard Deviation (Sample) | 23.4% | 32.4% |
| Standard Deviation (Population) | 23.2% | 31.3% |
Similar Demographics by Single Male Poverty
Demographics Similar to Pakistanis by Single Male Poverty
In terms of single male poverty, the demographic groups most similar to Pakistanis are Nicaraguan (12.4%, a difference of 0.050%), Immigrants from Southern Europe (12.4%, a difference of 0.15%), Kenyan (12.4%, a difference of 0.19%), Immigrants from Syria (12.4%, a difference of 0.21%), and Immigrants from Oceania (12.4%, a difference of 0.22%).
| Demographics | Rating | Rank | Single Male Poverty |
| Immigrants | Morocco | 95.6 /100 | #106 | Exceptional 12.3% |
| Iraqis | 95.1 /100 | #107 | Exceptional 12.3% |
| Immigrants | Eastern Africa | 95.0 /100 | #108 | Exceptional 12.3% |
| Ugandans | 94.5 /100 | #109 | Exceptional 12.3% |
| Immigrants | Portugal | 93.6 /100 | #110 | Exceptional 12.3% |
| Immigrants | North Macedonia | 93.6 /100 | #111 | Exceptional 12.3% |
| Kenyans | 93.3 /100 | #112 | Exceptional 12.4% |
| Pakistanis | 92.4 /100 | #113 | Exceptional 12.4% |
| Nicaraguans | 92.1 /100 | #114 | Exceptional 12.4% |
| Immigrants | Southern Europe | 91.5 /100 | #115 | Exceptional 12.4% |
| Immigrants | Syria | 91.2 /100 | #116 | Exceptional 12.4% |
| Immigrants | Oceania | 91.1 /100 | #117 | Exceptional 12.4% |
| Albanians | 90.6 /100 | #118 | Exceptional 12.4% |
| Immigrants | Albania | 90.3 /100 | #119 | Exceptional 12.4% |
| Venezuelans | 89.4 /100 | #120 | Excellent 12.4% |
Demographics Similar to Immigrants from Switzerland by Single Male Poverty
In terms of single male poverty, the demographic groups most similar to Immigrants from Switzerland are Immigrants from Canada (12.8%, a difference of 0.090%), Israeli (12.9%, a difference of 0.11%), Syrian (12.8%, a difference of 0.28%), Immigrants from North America (12.9%, a difference of 0.29%), and Panamanian (12.9%, a difference of 0.30%).
| Demographics | Rating | Rank | Single Male Poverty |
| South Africans | 51.5 /100 | #171 | Average 12.8% |
| Danes | 51.4 /100 | #172 | Average 12.8% |
| Immigrants | St. Vincent and the Grenadines | 50.9 /100 | #173 | Average 12.8% |
| Costa Ricans | 50.0 /100 | #174 | Average 12.8% |
| Croatians | 48.9 /100 | #175 | Average 12.8% |
| Syrians | 48.4 /100 | #176 | Average 12.8% |
| Immigrants | Canada | 44.8 /100 | #177 | Average 12.8% |
| Immigrants | Switzerland | 43.1 /100 | #178 | Average 12.8% |
| Israelis | 41.0 /100 | #179 | Average 12.9% |
| Immigrants | North America | 37.7 /100 | #180 | Fair 12.9% |
| Panamanians | 37.6 /100 | #181 | Fair 12.9% |
| Moroccans | 36.8 /100 | #182 | Fair 12.9% |
| Immigrants | West Indies | 33.0 /100 | #183 | Fair 12.9% |
| Immigrants | Trinidad and Tobago | 32.5 /100 | #184 | Fair 12.9% |
| Norwegians | 32.0 /100 | #185 | Fair 12.9% |