Dutch West Indian vs Immigrants from Haiti Child Poverty Among Girls Under 16
COMPARE
Dutch West Indian
Immigrants from Haiti
Child Poverty Among Girls Under 16
Child Poverty Among Girls Under 16 Comparison
Dutch West Indians
Immigrants from Haiti
21.6%
CHILD POVERTY AMONG GIRLS UNDER 16
0.0/ 100
METRIC RATING
311th/ 347
METRIC RANK
20.6%
CHILD POVERTY AMONG GIRLS UNDER 16
0.0/ 100
METRIC RATING
290th/ 347
METRIC RANK
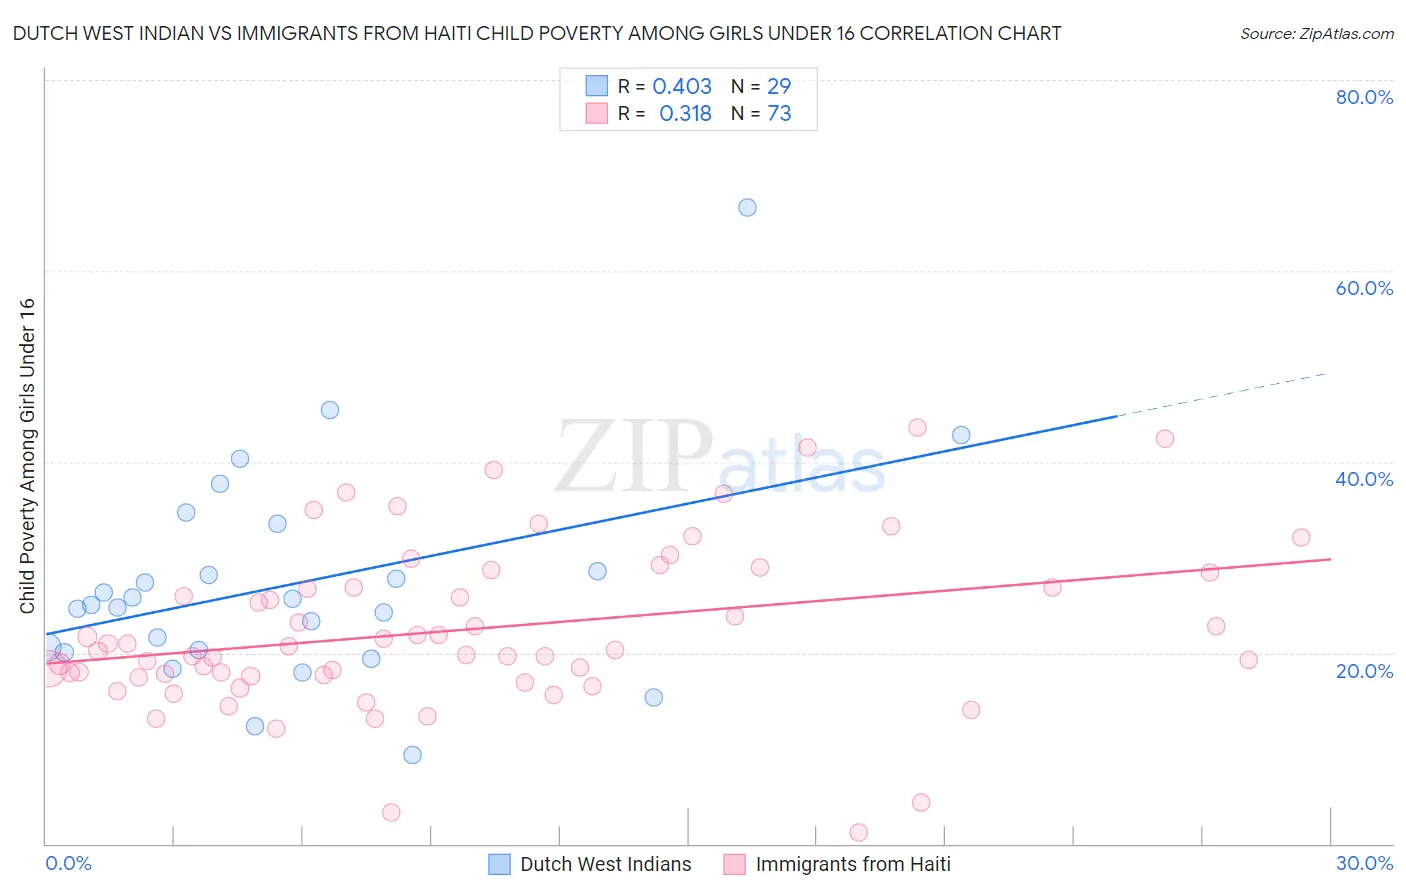
Dutch West Indian vs Immigrants from Haiti Child Poverty Among Girls Under 16 Correlation Chart
The statistical analysis conducted on geographies consisting of 85,504,644 people shows a moderate positive correlation between the proportion of Dutch West Indians and poverty level among girls under the age of 16 in the United States with a correlation coefficient (R) of 0.403 and weighted average of 21.6%. Similarly, the statistical analysis conducted on geographies consisting of 222,631,000 people shows a mild positive correlation between the proportion of Immigrants from Haiti and poverty level among girls under the age of 16 in the United States with a correlation coefficient (R) of 0.318 and weighted average of 20.6%, a difference of 4.7%.
Child Poverty Among Girls Under 16 Correlation Summary
| Measurement | Dutch West Indian | Immigrants from Haiti |
| Minimum | 9.2% | 1.1% |
| Maximum | 66.7% | 43.6% |
| Range | 57.4% | 42.5% |
| Mean | 27.2% | 22.4% |
| Median | 25.0% | 20.3% |
| Interquartile 25% (IQ1) | 20.2% | 17.6% |
| Interquartile 75% (IQ3) | 31.0% | 27.6% |
| Interquartile Range (IQR) | 10.8% | 10.0% |
| Standard Deviation (Sample) | 11.4% | 8.6% |
| Standard Deviation (Population) | 11.2% | 8.5% |
Similar Demographics by Child Poverty Among Girls Under 16
Demographics Similar to Dutch West Indians by Child Poverty Among Girls Under 16
In terms of child poverty among girls under 16, the demographic groups most similar to Dutch West Indians are Immigrants from Somalia (21.6%, a difference of 0.060%), Immigrants from Mexico (21.6%, a difference of 0.23%), Bahamian (21.5%, a difference of 0.33%), Houma (21.5%, a difference of 0.46%), and Immigrants from Bahamas (21.4%, a difference of 0.63%).
| Demographics | Rating | Rank | Child Poverty Among Girls Under 16 |
| Indonesians | 0.0 /100 | #304 | Tragic 21.3% |
| Guatemalans | 0.0 /100 | #305 | Tragic 21.4% |
| Immigrants | Central America | 0.0 /100 | #306 | Tragic 21.4% |
| Immigrants | Bahamas | 0.0 /100 | #307 | Tragic 21.4% |
| Houma | 0.0 /100 | #308 | Tragic 21.5% |
| Bahamians | 0.0 /100 | #309 | Tragic 21.5% |
| Immigrants | Somalia | 0.0 /100 | #310 | Tragic 21.6% |
| Dutch West Indians | 0.0 /100 | #311 | Tragic 21.6% |
| Immigrants | Mexico | 0.0 /100 | #312 | Tragic 21.6% |
| Creek | 0.0 /100 | #313 | Tragic 21.7% |
| Arapaho | 0.0 /100 | #314 | Tragic 21.7% |
| Ute | 0.0 /100 | #315 | Tragic 21.8% |
| Immigrants | Guatemala | 0.0 /100 | #316 | Tragic 21.9% |
| Africans | 0.0 /100 | #317 | Tragic 21.9% |
| Immigrants | Dominica | 0.0 /100 | #318 | Tragic 22.1% |
Demographics Similar to Immigrants from Haiti by Child Poverty Among Girls Under 16
In terms of child poverty among girls under 16, the demographic groups most similar to Immigrants from Haiti are Immigrants from Belize (20.6%, a difference of 0.070%), Chippewa (20.6%, a difference of 0.13%), Immigrants from Latin America (20.6%, a difference of 0.20%), Immigrants from Grenada (20.7%, a difference of 0.24%), and Immigrants from Senegal (20.7%, a difference of 0.35%).
| Demographics | Rating | Rank | Child Poverty Among Girls Under 16 |
| Senegalese | 0.0 /100 | #283 | Tragic 20.3% |
| Yaqui | 0.0 /100 | #284 | Tragic 20.3% |
| Immigrants | Cabo Verde | 0.0 /100 | #285 | Tragic 20.3% |
| Iroquois | 0.0 /100 | #286 | Tragic 20.4% |
| Blackfeet | 0.0 /100 | #287 | Tragic 20.5% |
| Haitians | 0.0 /100 | #288 | Tragic 20.5% |
| Immigrants | Belize | 0.0 /100 | #289 | Tragic 20.6% |
| Immigrants | Haiti | 0.0 /100 | #290 | Tragic 20.6% |
| Chippewa | 0.0 /100 | #291 | Tragic 20.6% |
| Immigrants | Latin America | 0.0 /100 | #292 | Tragic 20.6% |
| Immigrants | Grenada | 0.0 /100 | #293 | Tragic 20.7% |
| Immigrants | Senegal | 0.0 /100 | #294 | Tragic 20.7% |
| Immigrants | Caribbean | 0.0 /100 | #295 | Tragic 20.7% |
| Immigrants | West Indies | 0.0 /100 | #296 | Tragic 20.7% |
| Inupiat | 0.0 /100 | #297 | Tragic 20.8% |