Dutch West Indian vs Immigrants from Europe Child Poverty Among Girls Under 16
COMPARE
Dutch West Indian
Immigrants from Europe
Child Poverty Among Girls Under 16
Child Poverty Among Girls Under 16 Comparison
Dutch West Indians
Immigrants from Europe
21.6%
CHILD POVERTY AMONG GIRLS UNDER 16
0.0/ 100
METRIC RATING
311th/ 347
METRIC RANK
14.4%
CHILD POVERTY AMONG GIRLS UNDER 16
98.7/ 100
METRIC RATING
63rd/ 347
METRIC RANK
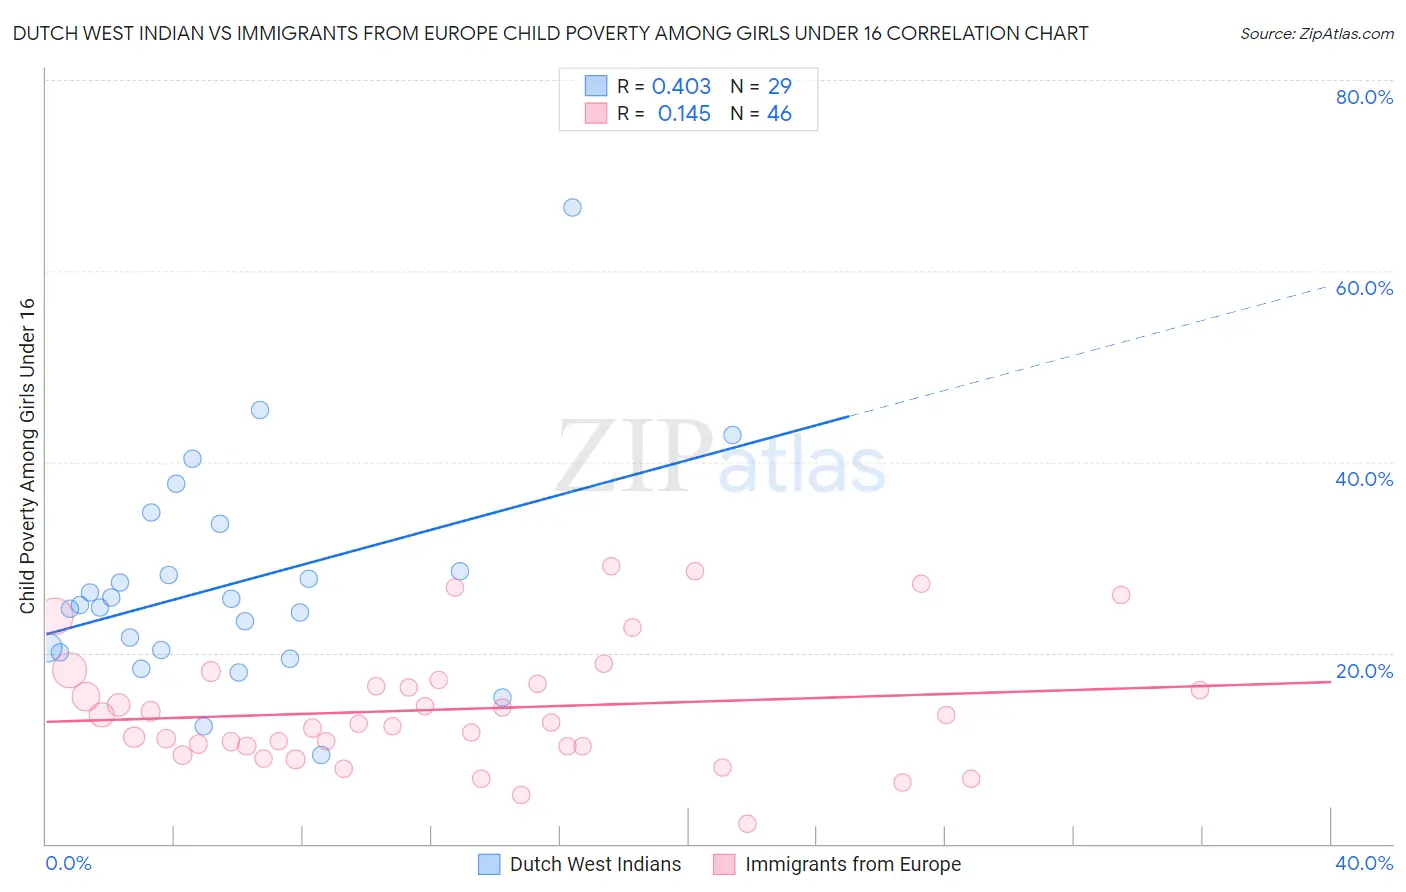
Dutch West Indian vs Immigrants from Europe Child Poverty Among Girls Under 16 Correlation Chart
The statistical analysis conducted on geographies consisting of 85,504,644 people shows a moderate positive correlation between the proportion of Dutch West Indians and poverty level among girls under the age of 16 in the United States with a correlation coefficient (R) of 0.403 and weighted average of 21.6%. Similarly, the statistical analysis conducted on geographies consisting of 528,272,896 people shows a poor positive correlation between the proportion of Immigrants from Europe and poverty level among girls under the age of 16 in the United States with a correlation coefficient (R) of 0.145 and weighted average of 14.4%, a difference of 49.5%.
Child Poverty Among Girls Under 16 Correlation Summary
| Measurement | Dutch West Indian | Immigrants from Europe |
| Minimum | 9.2% | 2.1% |
| Maximum | 66.7% | 29.0% |
| Range | 57.4% | 26.9% |
| Mean | 27.2% | 14.1% |
| Median | 25.0% | 12.6% |
| Interquartile 25% (IQ1) | 20.2% | 10.2% |
| Interquartile 75% (IQ3) | 31.0% | 16.7% |
| Interquartile Range (IQR) | 10.8% | 6.5% |
| Standard Deviation (Sample) | 11.4% | 6.4% |
| Standard Deviation (Population) | 11.2% | 6.3% |
Similar Demographics by Child Poverty Among Girls Under 16
Demographics Similar to Dutch West Indians by Child Poverty Among Girls Under 16
In terms of child poverty among girls under 16, the demographic groups most similar to Dutch West Indians are Immigrants from Somalia (21.6%, a difference of 0.060%), Immigrants from Mexico (21.6%, a difference of 0.23%), Bahamian (21.5%, a difference of 0.33%), Houma (21.5%, a difference of 0.46%), and Immigrants from Bahamas (21.4%, a difference of 0.63%).
| Demographics | Rating | Rank | Child Poverty Among Girls Under 16 |
| Indonesians | 0.0 /100 | #304 | Tragic 21.3% |
| Guatemalans | 0.0 /100 | #305 | Tragic 21.4% |
| Immigrants | Central America | 0.0 /100 | #306 | Tragic 21.4% |
| Immigrants | Bahamas | 0.0 /100 | #307 | Tragic 21.4% |
| Houma | 0.0 /100 | #308 | Tragic 21.5% |
| Bahamians | 0.0 /100 | #309 | Tragic 21.5% |
| Immigrants | Somalia | 0.0 /100 | #310 | Tragic 21.6% |
| Dutch West Indians | 0.0 /100 | #311 | Tragic 21.6% |
| Immigrants | Mexico | 0.0 /100 | #312 | Tragic 21.6% |
| Creek | 0.0 /100 | #313 | Tragic 21.7% |
| Arapaho | 0.0 /100 | #314 | Tragic 21.7% |
| Ute | 0.0 /100 | #315 | Tragic 21.8% |
| Immigrants | Guatemala | 0.0 /100 | #316 | Tragic 21.9% |
| Africans | 0.0 /100 | #317 | Tragic 21.9% |
| Immigrants | Dominica | 0.0 /100 | #318 | Tragic 22.1% |
Demographics Similar to Immigrants from Europe by Child Poverty Among Girls Under 16
In terms of child poverty among girls under 16, the demographic groups most similar to Immigrants from Europe are Scandinavian (14.4%, a difference of 0.050%), Immigrants from Philippines (14.4%, a difference of 0.11%), Immigrants from Sweden (14.5%, a difference of 0.14%), Polish (14.4%, a difference of 0.16%), and Cambodian (14.4%, a difference of 0.16%).
| Demographics | Rating | Rank | Child Poverty Among Girls Under 16 |
| Immigrants | Indonesia | 98.9 /100 | #56 | Exceptional 14.4% |
| Immigrants | Serbia | 98.9 /100 | #57 | Exceptional 14.4% |
| Immigrants | Bulgaria | 98.8 /100 | #58 | Exceptional 14.4% |
| Zimbabweans | 98.8 /100 | #59 | Exceptional 14.4% |
| Poles | 98.7 /100 | #60 | Exceptional 14.4% |
| Cambodians | 98.7 /100 | #61 | Exceptional 14.4% |
| Scandinavians | 98.7 /100 | #62 | Exceptional 14.4% |
| Immigrants | Europe | 98.7 /100 | #63 | Exceptional 14.4% |
| Immigrants | Philippines | 98.6 /100 | #64 | Exceptional 14.4% |
| Immigrants | Sweden | 98.6 /100 | #65 | Exceptional 14.5% |
| Immigrants | Belgium | 98.5 /100 | #66 | Exceptional 14.5% |
| Laotians | 98.4 /100 | #67 | Exceptional 14.5% |
| Immigrants | Argentina | 98.3 /100 | #68 | Exceptional 14.6% |
| Immigrants | Poland | 98.2 /100 | #69 | Exceptional 14.6% |
| Europeans | 98.1 /100 | #70 | Exceptional 14.6% |