Delaware vs Immigrants from Central America Receiving Food Stamps
COMPARE
Delaware
Immigrants from Central America
Receiving Food Stamps
Receiving Food Stamps Comparison
Delaware
Immigrants from Central America
12.2%
RECEIVING FOOD STAMPS
26.1/ 100
METRIC RATING
197th/ 347
METRIC RANK
15.0%
RECEIVING FOOD STAMPS
0.0/ 100
METRIC RATING
282nd/ 347
METRIC RANK
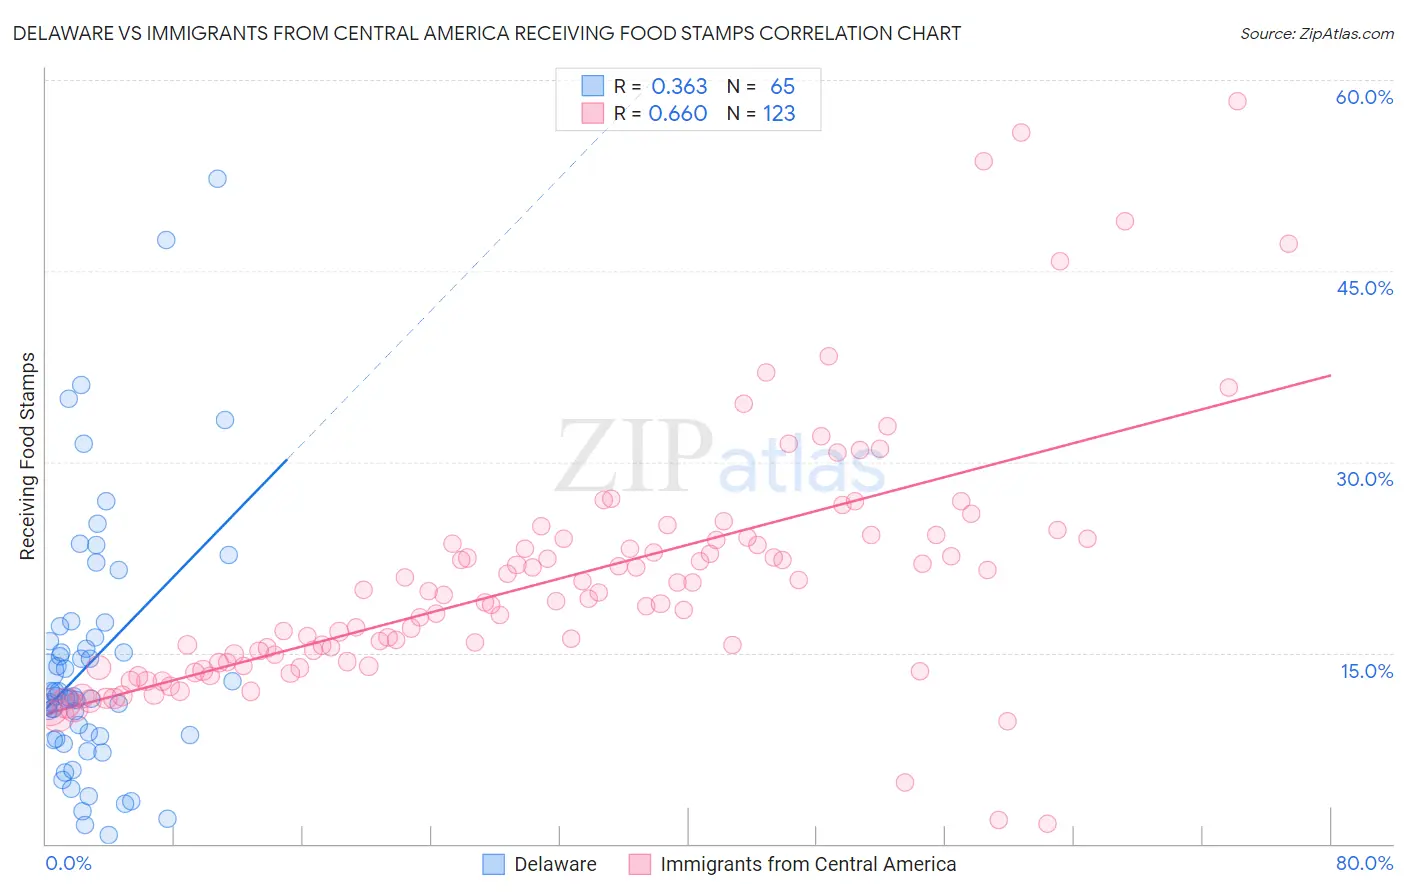
Delaware vs Immigrants from Central America Receiving Food Stamps Correlation Chart
The statistical analysis conducted on geographies consisting of 96,117,712 people shows a mild positive correlation between the proportion of Delaware and percentage of population receiving government assistance and/or food stamps in the United States with a correlation coefficient (R) of 0.363 and weighted average of 12.2%. Similarly, the statistical analysis conducted on geographies consisting of 534,248,687 people shows a significant positive correlation between the proportion of Immigrants from Central America and percentage of population receiving government assistance and/or food stamps in the United States with a correlation coefficient (R) of 0.660 and weighted average of 15.0%, a difference of 23.3%.
Receiving Food Stamps Correlation Summary
| Measurement | Delaware | Immigrants from Central America |
| Minimum | 0.70% | 1.6% |
| Maximum | 52.2% | 58.3% |
| Range | 51.5% | 56.7% |
| Mean | 14.3% | 20.7% |
| Median | 11.6% | 19.3% |
| Interquartile 25% (IQ1) | 8.4% | 14.2% |
| Interquartile 75% (IQ3) | 16.7% | 24.0% |
| Interquartile Range (IQR) | 8.3% | 9.7% |
| Standard Deviation (Sample) | 10.1% | 9.7% |
| Standard Deviation (Population) | 10.1% | 9.7% |
Similar Demographics by Receiving Food Stamps
Demographics Similar to Delaware by Receiving Food Stamps
In terms of receiving food stamps, the demographic groups most similar to Delaware are Iraqi (12.2%, a difference of 0.080%), American (12.2%, a difference of 0.11%), Immigrants from Costa Rica (12.2%, a difference of 0.13%), Immigrants from Sudan (12.1%, a difference of 0.17%), and Portuguese (12.2%, a difference of 0.18%).
| Demographics | Rating | Rank | Receiving Food Stamps |
| Immigrants | Peru | 32.2 /100 | #190 | Fair 12.0% |
| Venezuelans | 32.1 /100 | #191 | Fair 12.0% |
| Samoans | 31.0 /100 | #192 | Fair 12.1% |
| Immigrants | Fiji | 27.8 /100 | #193 | Fair 12.1% |
| Immigrants | Sudan | 27.1 /100 | #194 | Fair 12.1% |
| Americans | 26.7 /100 | #195 | Fair 12.2% |
| Iraqis | 26.6 /100 | #196 | Fair 12.2% |
| Delaware | 26.1 /100 | #197 | Fair 12.2% |
| Immigrants | Costa Rica | 25.4 /100 | #198 | Fair 12.2% |
| Portuguese | 25.1 /100 | #199 | Fair 12.2% |
| Sierra Leoneans | 23.6 /100 | #200 | Fair 12.2% |
| Ugandans | 22.5 /100 | #201 | Fair 12.2% |
| Immigrants | Venezuela | 20.1 /100 | #202 | Fair 12.3% |
| Shoshone | 17.7 /100 | #203 | Poor 12.4% |
| Immigrants | Nonimmigrants | 17.6 /100 | #204 | Poor 12.4% |
Demographics Similar to Immigrants from Central America by Receiving Food Stamps
In terms of receiving food stamps, the demographic groups most similar to Immigrants from Central America are Bangladeshi (15.0%, a difference of 0.28%), Immigrants from Ecuador (15.0%, a difference of 0.29%), Spanish American Indian (14.9%, a difference of 0.52%), Immigrants from Liberia (15.1%, a difference of 0.67%), and African (15.1%, a difference of 0.81%).
| Demographics | Rating | Rank | Receiving Food Stamps |
| Ute | 0.1 /100 | #275 | Tragic 14.7% |
| Liberians | 0.1 /100 | #276 | Tragic 14.8% |
| Seminole | 0.1 /100 | #277 | Tragic 14.8% |
| Belizeans | 0.1 /100 | #278 | Tragic 14.8% |
| Kiowa | 0.0 /100 | #279 | Tragic 14.9% |
| Ecuadorians | 0.0 /100 | #280 | Tragic 14.9% |
| Spanish American Indians | 0.0 /100 | #281 | Tragic 14.9% |
| Immigrants | Central America | 0.0 /100 | #282 | Tragic 15.0% |
| Bangladeshis | 0.0 /100 | #283 | Tragic 15.0% |
| Immigrants | Ecuador | 0.0 /100 | #284 | Tragic 15.0% |
| Immigrants | Liberia | 0.0 /100 | #285 | Tragic 15.1% |
| Africans | 0.0 /100 | #286 | Tragic 15.1% |
| Immigrants | Mexico | 0.0 /100 | #287 | Tragic 15.2% |
| Immigrants | Belize | 0.0 /100 | #288 | Tragic 15.2% |
| Immigrants | Senegal | 0.0 /100 | #289 | Tragic 15.3% |