Czech vs Costa Rican Receiving Food Stamps
COMPARE
Czech
Costa Rican
Receiving Food Stamps
Receiving Food Stamps Comparison
Czechs
Costa Ricans
9.2%
RECEIVING FOOD STAMPS
99.8/ 100
METRIC RATING
28th/ 347
METRIC RANK
11.6%
RECEIVING FOOD STAMPS
57.9/ 100
METRIC RATING
170th/ 347
METRIC RANK
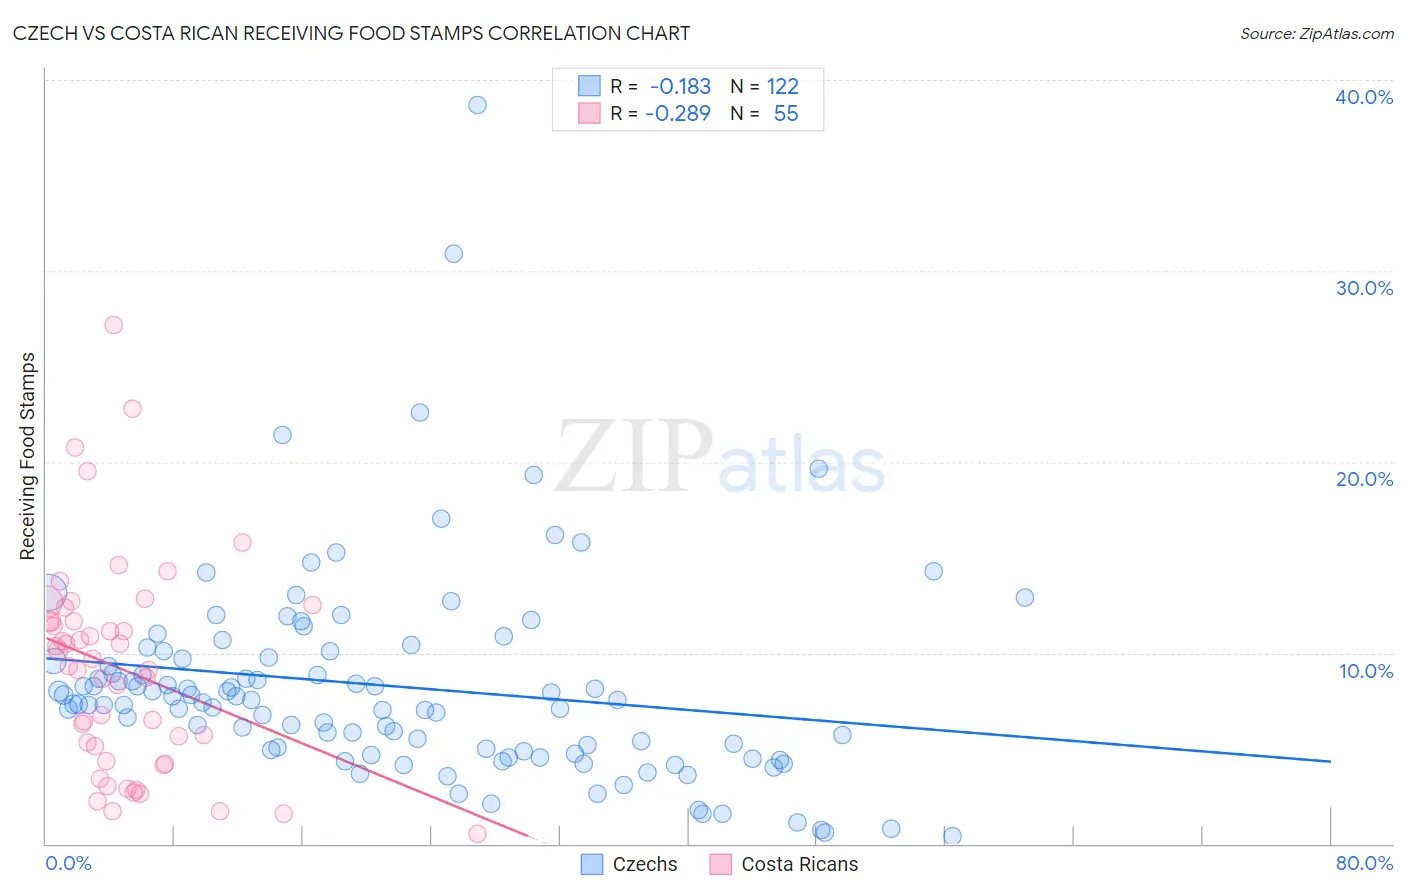
Czech vs Costa Rican Receiving Food Stamps Correlation Chart
The statistical analysis conducted on geographies consisting of 482,652,589 people shows a poor negative correlation between the proportion of Czechs and percentage of population receiving government assistance and/or food stamps in the United States with a correlation coefficient (R) of -0.183 and weighted average of 9.2%. Similarly, the statistical analysis conducted on geographies consisting of 253,245,206 people shows a weak negative correlation between the proportion of Costa Ricans and percentage of population receiving government assistance and/or food stamps in the United States with a correlation coefficient (R) of -0.289 and weighted average of 11.6%, a difference of 25.9%.
Receiving Food Stamps Correlation Summary
| Measurement | Czech | Costa Rican |
| Minimum | 0.40% | 0.50% |
| Maximum | 38.7% | 27.2% |
| Range | 38.3% | 26.7% |
| Mean | 8.3% | 9.1% |
| Median | 7.5% | 9.3% |
| Interquartile 25% (IQ1) | 4.9% | 4.3% |
| Interquartile 75% (IQ3) | 9.7% | 11.7% |
| Interquartile Range (IQR) | 4.8% | 7.4% |
| Standard Deviation (Sample) | 5.5% | 5.6% |
| Standard Deviation (Population) | 5.4% | 5.5% |
Similar Demographics by Receiving Food Stamps
Demographics Similar to Czechs by Receiving Food Stamps
In terms of receiving food stamps, the demographic groups most similar to Czechs are Bhutanese (9.2%, a difference of 0.010%), Swedish (9.2%, a difference of 0.25%), Immigrants from Lithuania (9.2%, a difference of 0.27%), Immigrants from Ireland (9.2%, a difference of 0.45%), and Immigrants from Northern Europe (9.2%, a difference of 0.55%).
| Demographics | Rating | Rank | Receiving Food Stamps |
| Luxembourgers | 99.8 /100 | #21 | Exceptional 9.1% |
| Immigrants | Australia | 99.8 /100 | #22 | Exceptional 9.2% |
| Eastern Europeans | 99.8 /100 | #23 | Exceptional 9.2% |
| Immigrants | Northern Europe | 99.8 /100 | #24 | Exceptional 9.2% |
| Immigrants | Ireland | 99.8 /100 | #25 | Exceptional 9.2% |
| Swedes | 99.8 /100 | #26 | Exceptional 9.2% |
| Bhutanese | 99.8 /100 | #27 | Exceptional 9.2% |
| Czechs | 99.8 /100 | #28 | Exceptional 9.2% |
| Immigrants | Lithuania | 99.8 /100 | #29 | Exceptional 9.2% |
| Immigrants | Sweden | 99.7 /100 | #30 | Exceptional 9.3% |
| Immigrants | Eastern Asia | 99.7 /100 | #31 | Exceptional 9.3% |
| Bolivians | 99.7 /100 | #32 | Exceptional 9.3% |
| Zimbabweans | 99.6 /100 | #33 | Exceptional 9.5% |
| Turks | 99.6 /100 | #34 | Exceptional 9.5% |
| Immigrants | Austria | 99.6 /100 | #35 | Exceptional 9.5% |
Demographics Similar to Costa Ricans by Receiving Food Stamps
In terms of receiving food stamps, the demographic groups most similar to Costa Ricans are Immigrants from Eastern Africa (11.6%, a difference of 0.060%), Tlingit-Haida (11.6%, a difference of 0.18%), Immigrants from Western Asia (11.6%, a difference of 0.22%), Kenyan (11.6%, a difference of 0.35%), and Guamanian/Chamorro (11.7%, a difference of 0.53%).
| Demographics | Rating | Rank | Receiving Food Stamps |
| Immigrants | Southern Europe | 65.8 /100 | #163 | Good 11.5% |
| Immigrants | Chile | 65.0 /100 | #164 | Good 11.5% |
| Arabs | 64.7 /100 | #165 | Good 11.5% |
| Immigrants | Belarus | 62.8 /100 | #166 | Good 11.5% |
| Kenyans | 60.2 /100 | #167 | Good 11.6% |
| Tlingit-Haida | 59.1 /100 | #168 | Average 11.6% |
| Immigrants | Eastern Africa | 58.3 /100 | #169 | Average 11.6% |
| Costa Ricans | 57.9 /100 | #170 | Average 11.6% |
| Immigrants | Western Asia | 56.4 /100 | #171 | Average 11.6% |
| Guamanians/Chamorros | 54.2 /100 | #172 | Average 11.7% |
| Immigrants | Syria | 53.4 /100 | #173 | Average 11.7% |
| Immigrants | Eritrea | 50.0 /100 | #174 | Average 11.7% |
| Osage | 49.8 /100 | #175 | Average 11.7% |
| Peruvians | 49.3 /100 | #176 | Average 11.7% |
| Immigrants | Ukraine | 48.4 /100 | #177 | Average 11.8% |