Immigrants from Eastern Africa vs Costa Rican Receiving Food Stamps
COMPARE
Immigrants from Eastern Africa
Costa Rican
Receiving Food Stamps
Receiving Food Stamps Comparison
Immigrants from Eastern Africa
Costa Ricans
11.6%
RECEIVING FOOD STAMPS
58.3/ 100
METRIC RATING
169th/ 347
METRIC RANK
11.6%
RECEIVING FOOD STAMPS
57.9/ 100
METRIC RATING
170th/ 347
METRIC RANK
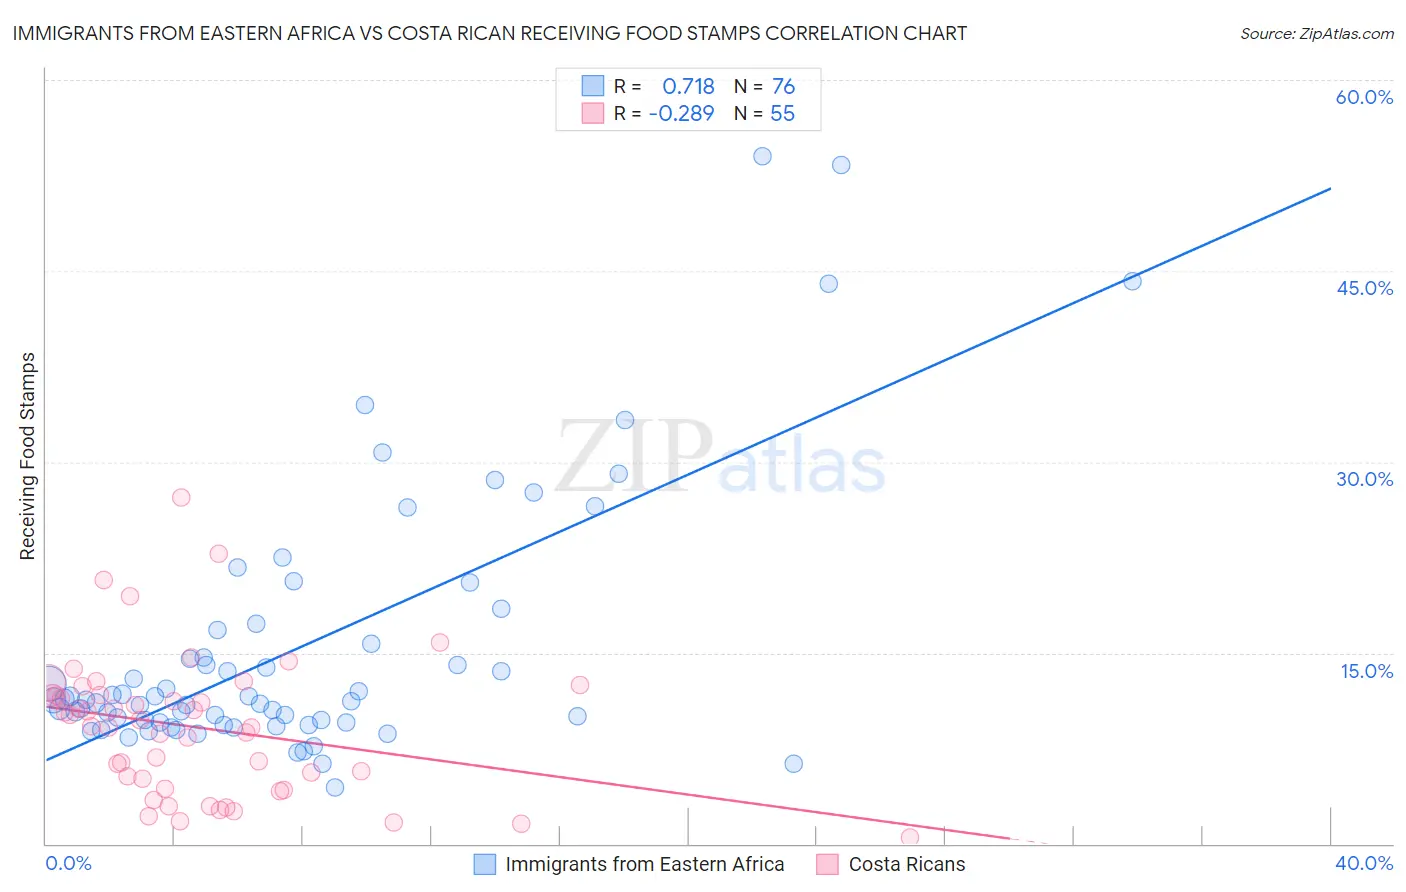
Immigrants from Eastern Africa vs Costa Rican Receiving Food Stamps Correlation Chart
The statistical analysis conducted on geographies consisting of 354,350,740 people shows a strong positive correlation between the proportion of Immigrants from Eastern Africa and percentage of population receiving government assistance and/or food stamps in the United States with a correlation coefficient (R) of 0.718 and weighted average of 11.6%. Similarly, the statistical analysis conducted on geographies consisting of 253,245,206 people shows a weak negative correlation between the proportion of Costa Ricans and percentage of population receiving government assistance and/or food stamps in the United States with a correlation coefficient (R) of -0.289 and weighted average of 11.6%, a difference of 0.060%.
Receiving Food Stamps Correlation Summary
| Measurement | Immigrants from Eastern Africa | Costa Rican |
| Minimum | 4.4% | 0.50% |
| Maximum | 54.0% | 27.2% |
| Range | 49.6% | 26.7% |
| Mean | 15.4% | 9.1% |
| Median | 11.3% | 9.3% |
| Interquartile 25% (IQ1) | 9.5% | 4.3% |
| Interquartile 75% (IQ3) | 16.2% | 11.7% |
| Interquartile Range (IQR) | 6.7% | 7.4% |
| Standard Deviation (Sample) | 10.4% | 5.6% |
| Standard Deviation (Population) | 10.3% | 5.5% |
Demographics Similar to Immigrants from Eastern Africa and Costa Ricans by Receiving Food Stamps
In terms of receiving food stamps, the demographic groups most similar to Immigrants from Eastern Africa are Tlingit-Haida (11.6%, a difference of 0.12%), Kenyan (11.6%, a difference of 0.28%), Immigrants from Western Asia (11.6%, a difference of 0.28%), Guamanian/Chamorro (11.7%, a difference of 0.60%), and Immigrants from Belarus (11.5%, a difference of 0.67%). Similarly, the demographic groups most similar to Costa Ricans are Tlingit-Haida (11.6%, a difference of 0.18%), Immigrants from Western Asia (11.6%, a difference of 0.22%), Kenyan (11.6%, a difference of 0.35%), Guamanian/Chamorro (11.7%, a difference of 0.53%), and Immigrants from Syria (11.7%, a difference of 0.64%).
| Demographics | Rating | Rank | Receiving Food Stamps |
| Immigrants | Oceania | 70.4 /100 | #159 | Good 11.4% |
| French Canadians | 69.5 /100 | #160 | Good 11.4% |
| Pennsylvania Germans | 68.4 /100 | #161 | Good 11.4% |
| Alsatians | 68.0 /100 | #162 | Good 11.4% |
| Immigrants | Southern Europe | 65.8 /100 | #163 | Good 11.5% |
| Immigrants | Chile | 65.0 /100 | #164 | Good 11.5% |
| Arabs | 64.7 /100 | #165 | Good 11.5% |
| Immigrants | Belarus | 62.8 /100 | #166 | Good 11.5% |
| Kenyans | 60.2 /100 | #167 | Good 11.6% |
| Tlingit-Haida | 59.1 /100 | #168 | Average 11.6% |
| Immigrants | Eastern Africa | 58.3 /100 | #169 | Average 11.6% |
| Costa Ricans | 57.9 /100 | #170 | Average 11.6% |
| Immigrants | Western Asia | 56.4 /100 | #171 | Average 11.6% |
| Guamanians/Chamorros | 54.2 /100 | #172 | Average 11.7% |
| Immigrants | Syria | 53.4 /100 | #173 | Average 11.7% |
| Immigrants | Eritrea | 50.0 /100 | #174 | Average 11.7% |
| Osage | 49.8 /100 | #175 | Average 11.7% |
| Peruvians | 49.3 /100 | #176 | Average 11.7% |
| Immigrants | Ukraine | 48.4 /100 | #177 | Average 11.8% |
| German Russians | 48.1 /100 | #178 | Average 11.8% |
| Immigrants | Kenya | 46.4 /100 | #179 | Average 11.8% |