Creek vs Immigrants from Zaire Single Female Poverty
COMPARE
Creek
Immigrants from Zaire
Single Female Poverty
Single Female Poverty Comparison
Creek
Immigrants from Zaire
27.4%
SINGLE FEMALE POVERTY
0.0/ 100
METRIC RATING
326th/ 347
METRIC RANK
23.8%
SINGLE FEMALE POVERTY
0.0/ 100
METRIC RATING
281st/ 347
METRIC RANK
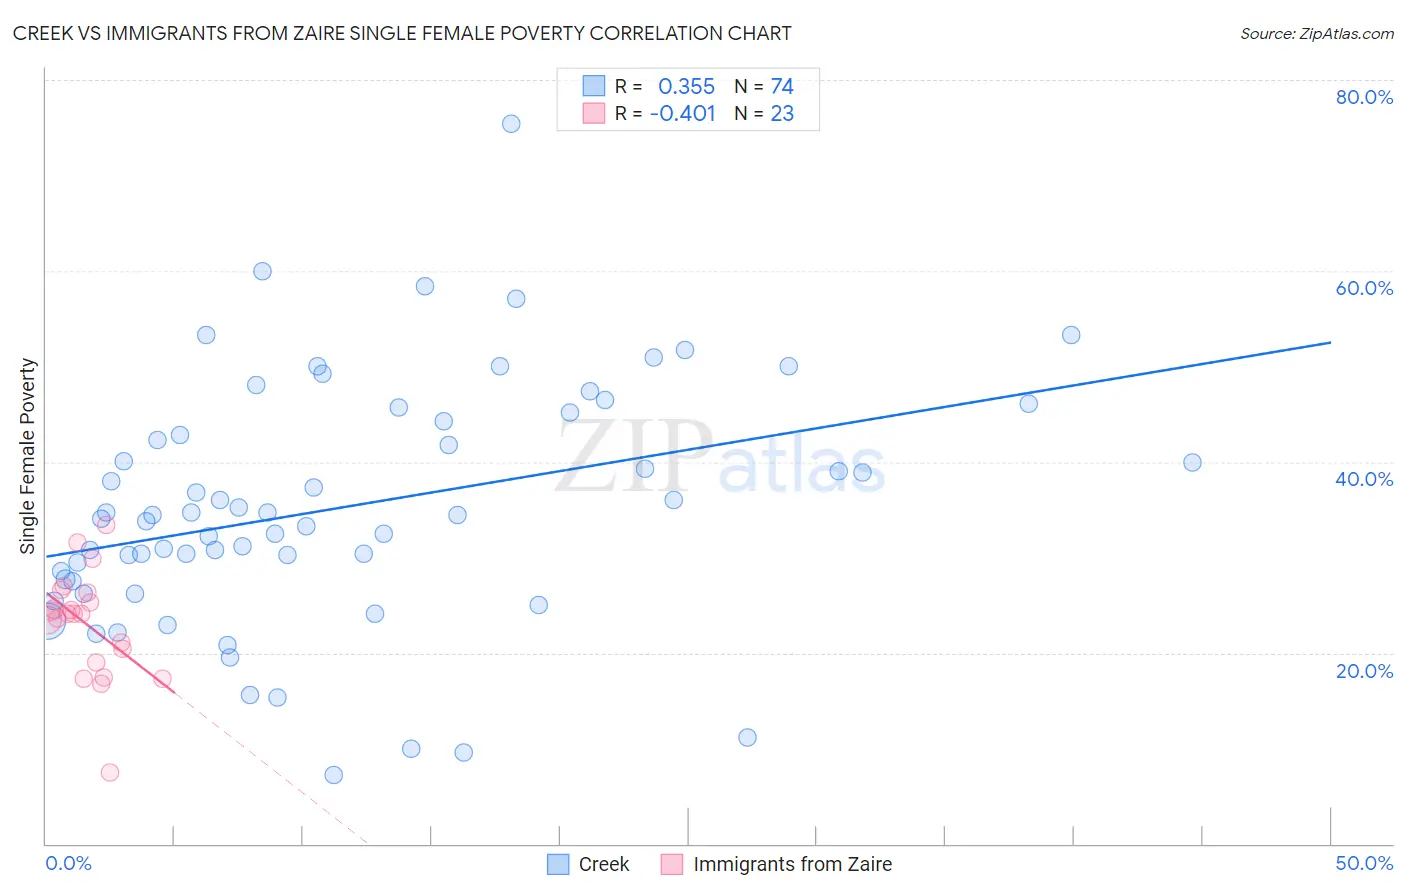
Creek vs Immigrants from Zaire Single Female Poverty Correlation Chart
The statistical analysis conducted on geographies consisting of 177,486,676 people shows a mild positive correlation between the proportion of Creek and poverty level among single females in the United States with a correlation coefficient (R) of 0.355 and weighted average of 27.4%. Similarly, the statistical analysis conducted on geographies consisting of 106,941,709 people shows a moderate negative correlation between the proportion of Immigrants from Zaire and poverty level among single females in the United States with a correlation coefficient (R) of -0.401 and weighted average of 23.8%, a difference of 15.1%.
Single Female Poverty Correlation Summary
| Measurement | Creek | Immigrants from Zaire |
| Minimum | 7.1% | 7.5% |
| Maximum | 75.4% | 33.4% |
| Range | 68.3% | 25.9% |
| Mean | 35.3% | 23.0% |
| Median | 34.4% | 24.0% |
| Interquartile 25% (IQ1) | 27.7% | 19.0% |
| Interquartile 75% (IQ3) | 44.3% | 26.3% |
| Interquartile Range (IQR) | 16.6% | 7.3% |
| Standard Deviation (Sample) | 12.7% | 5.6% |
| Standard Deviation (Population) | 12.6% | 5.5% |
Similar Demographics by Single Female Poverty
Demographics Similar to Creek by Single Female Poverty
In terms of single female poverty, the demographic groups most similar to Creek are Dutch West Indian (27.5%, a difference of 0.080%), Choctaw (27.2%, a difference of 0.88%), Apache (27.7%, a difference of 0.99%), Menominee (27.8%, a difference of 1.5%), and Kiowa (26.9%, a difference of 1.9%).
| Demographics | Rating | Rank | Single Female Poverty |
| Blacks/African Americans | 0.0 /100 | #319 | Tragic 26.4% |
| Arapaho | 0.0 /100 | #320 | Tragic 26.4% |
| Yup'ik | 0.0 /100 | #321 | Tragic 26.6% |
| Seminole | 0.0 /100 | #322 | Tragic 26.8% |
| Chippewa | 0.0 /100 | #323 | Tragic 26.8% |
| Kiowa | 0.0 /100 | #324 | Tragic 26.9% |
| Choctaw | 0.0 /100 | #325 | Tragic 27.2% |
| Creek | 0.0 /100 | #326 | Tragic 27.4% |
| Dutch West Indians | 0.0 /100 | #327 | Tragic 27.5% |
| Apache | 0.0 /100 | #328 | Tragic 27.7% |
| Menominee | 0.0 /100 | #329 | Tragic 27.8% |
| Hopi | 0.0 /100 | #330 | Tragic 28.0% |
| Natives/Alaskans | 0.0 /100 | #331 | Tragic 28.2% |
| Yakama | 0.0 /100 | #332 | Tragic 28.3% |
| Ute | 0.0 /100 | #333 | Tragic 28.4% |
Demographics Similar to Immigrants from Zaire by Single Female Poverty
In terms of single female poverty, the demographic groups most similar to Immigrants from Zaire are Guatemalan (23.8%, a difference of 0.050%), German Russian (23.9%, a difference of 0.20%), Immigrants from Dominica (23.9%, a difference of 0.31%), Immigrants from Latin America (23.7%, a difference of 0.51%), and Alaskan Athabascan (23.6%, a difference of 1.0%).
| Demographics | Rating | Rank | Single Female Poverty |
| Marshallese | 0.1 /100 | #274 | Tragic 23.3% |
| Mexican American Indians | 0.1 /100 | #275 | Tragic 23.4% |
| Immigrants | Azores | 0.0 /100 | #276 | Tragic 23.5% |
| Pennsylvania Germans | 0.0 /100 | #277 | Tragic 23.6% |
| Immigrants | Nonimmigrants | 0.0 /100 | #278 | Tragic 23.6% |
| Alaskan Athabascans | 0.0 /100 | #279 | Tragic 23.6% |
| Immigrants | Latin America | 0.0 /100 | #280 | Tragic 23.7% |
| Immigrants | Zaire | 0.0 /100 | #281 | Tragic 23.8% |
| Guatemalans | 0.0 /100 | #282 | Tragic 23.8% |
| German Russians | 0.0 /100 | #283 | Tragic 23.9% |
| Immigrants | Dominica | 0.0 /100 | #284 | Tragic 23.9% |
| Immigrants | Guatemala | 0.0 /100 | #285 | Tragic 24.1% |
| Cree | 0.0 /100 | #286 | Tragic 24.1% |
| Bangladeshis | 0.0 /100 | #287 | Tragic 24.2% |
| Spanish Americans | 0.0 /100 | #288 | Tragic 24.2% |