Choctaw vs Immigrants from Indonesia Single Female Poverty
COMPARE
Choctaw
Immigrants from Indonesia
Single Female Poverty
Single Female Poverty Comparison
Choctaw
Immigrants from Indonesia
27.2%
SINGLE FEMALE POVERTY
0.0/ 100
METRIC RATING
325th/ 347
METRIC RANK
18.9%
SINGLE FEMALE POVERTY
99.8/ 100
METRIC RATING
45th/ 347
METRIC RANK
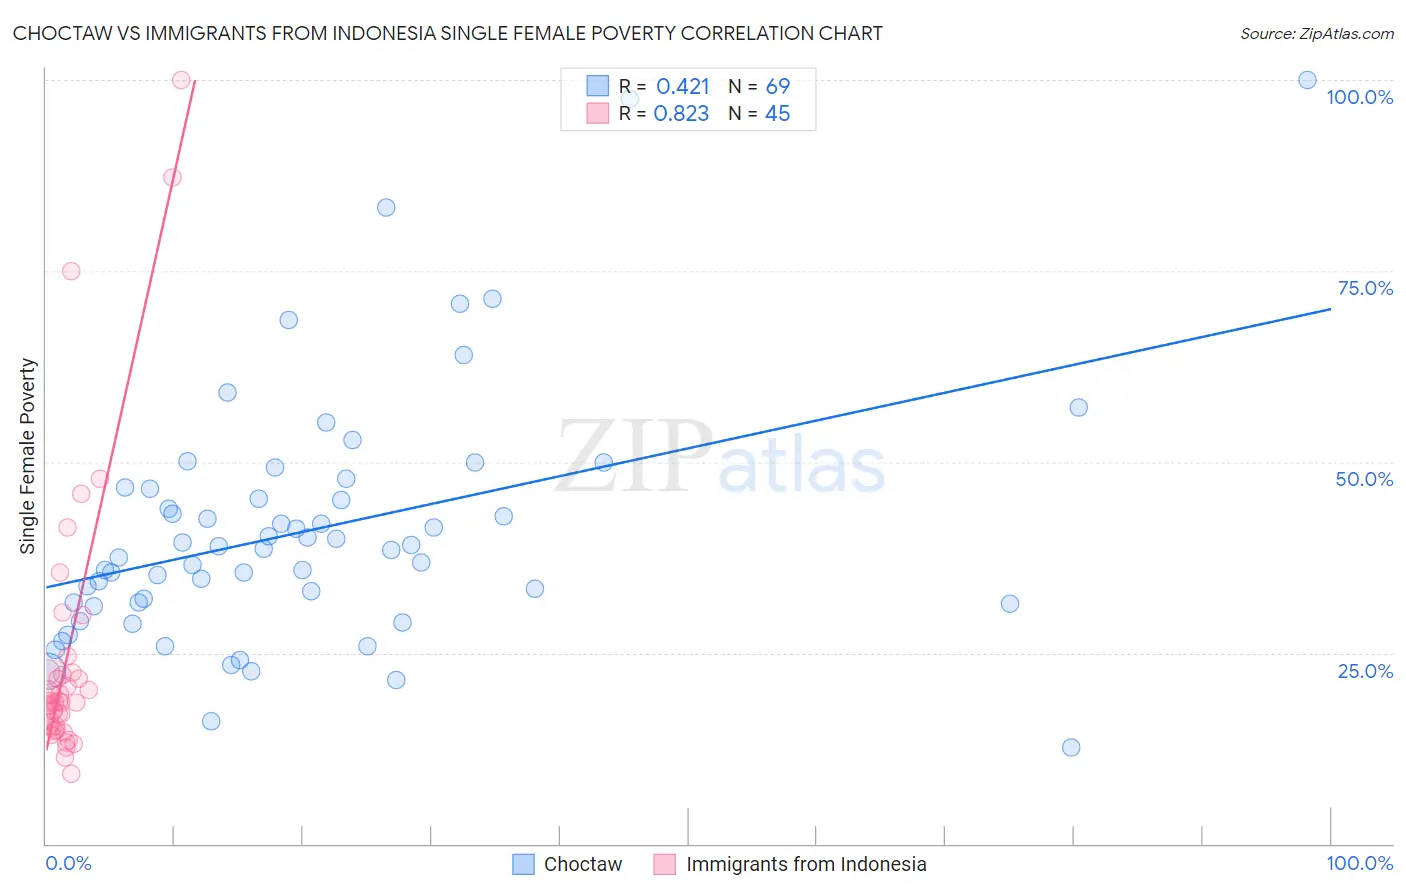
Choctaw vs Immigrants from Indonesia Single Female Poverty Correlation Chart
The statistical analysis conducted on geographies consisting of 267,534,581 people shows a moderate positive correlation between the proportion of Choctaw and poverty level among single females in the United States with a correlation coefficient (R) of 0.421 and weighted average of 27.2%. Similarly, the statistical analysis conducted on geographies consisting of 213,892,292 people shows a very strong positive correlation between the proportion of Immigrants from Indonesia and poverty level among single females in the United States with a correlation coefficient (R) of 0.823 and weighted average of 18.9%, a difference of 43.8%.
Single Female Poverty Correlation Summary
| Measurement | Choctaw | Immigrants from Indonesia |
| Minimum | 12.6% | 9.1% |
| Maximum | 100.0% | 100.0% |
| Range | 87.4% | 90.9% |
| Mean | 41.2% | 24.9% |
| Median | 38.6% | 18.5% |
| Interquartile 25% (IQ1) | 31.5% | 15.2% |
| Interquartile 75% (IQ3) | 46.6% | 22.5% |
| Interquartile Range (IQR) | 15.1% | 7.2% |
| Standard Deviation (Sample) | 16.5% | 19.0% |
| Standard Deviation (Population) | 16.4% | 18.8% |
Similar Demographics by Single Female Poverty
Demographics Similar to Choctaw by Single Female Poverty
In terms of single female poverty, the demographic groups most similar to Choctaw are Creek (27.4%, a difference of 0.88%), Dutch West Indian (27.5%, a difference of 0.96%), Kiowa (26.9%, a difference of 0.98%), Chippewa (26.8%, a difference of 1.4%), and Seminole (26.8%, a difference of 1.5%).
| Demographics | Rating | Rank | Single Female Poverty |
| Chickasaw | 0.0 /100 | #318 | Tragic 26.3% |
| Blacks/African Americans | 0.0 /100 | #319 | Tragic 26.4% |
| Arapaho | 0.0 /100 | #320 | Tragic 26.4% |
| Yup'ik | 0.0 /100 | #321 | Tragic 26.6% |
| Seminole | 0.0 /100 | #322 | Tragic 26.8% |
| Chippewa | 0.0 /100 | #323 | Tragic 26.8% |
| Kiowa | 0.0 /100 | #324 | Tragic 26.9% |
| Choctaw | 0.0 /100 | #325 | Tragic 27.2% |
| Creek | 0.0 /100 | #326 | Tragic 27.4% |
| Dutch West Indians | 0.0 /100 | #327 | Tragic 27.5% |
| Apache | 0.0 /100 | #328 | Tragic 27.7% |
| Menominee | 0.0 /100 | #329 | Tragic 27.8% |
| Hopi | 0.0 /100 | #330 | Tragic 28.0% |
| Natives/Alaskans | 0.0 /100 | #331 | Tragic 28.2% |
| Yakama | 0.0 /100 | #332 | Tragic 28.3% |
Demographics Similar to Immigrants from Indonesia by Single Female Poverty
In terms of single female poverty, the demographic groups most similar to Immigrants from Indonesia are Macedonian (18.9%, a difference of 0.16%), Immigrants from Croatia (18.9%, a difference of 0.21%), Latvian (19.0%, a difference of 0.35%), Immigrants from Romania (18.8%, a difference of 0.38%), and Jordanian (18.8%, a difference of 0.53%).
| Demographics | Rating | Rank | Single Female Poverty |
| Tongans | 99.9 /100 | #38 | Exceptional 18.8% |
| Bulgarians | 99.9 /100 | #39 | Exceptional 18.8% |
| Okinawans | 99.9 /100 | #40 | Exceptional 18.8% |
| Immigrants | Serbia | 99.9 /100 | #41 | Exceptional 18.8% |
| Jordanians | 99.9 /100 | #42 | Exceptional 18.8% |
| Immigrants | Romania | 99.9 /100 | #43 | Exceptional 18.8% |
| Immigrants | Croatia | 99.9 /100 | #44 | Exceptional 18.9% |
| Immigrants | Indonesia | 99.8 /100 | #45 | Exceptional 18.9% |
| Macedonians | 99.8 /100 | #46 | Exceptional 18.9% |
| Latvians | 99.8 /100 | #47 | Exceptional 19.0% |
| Immigrants | Argentina | 99.8 /100 | #48 | Exceptional 19.0% |
| Immigrants | Czechoslovakia | 99.8 /100 | #49 | Exceptional 19.0% |
| Immigrants | Eastern Europe | 99.8 /100 | #50 | Exceptional 19.0% |
| Immigrants | Italy | 99.8 /100 | #51 | Exceptional 19.0% |
| Egyptians | 99.7 /100 | #52 | Exceptional 19.1% |