Chippewa vs Creek Family Poverty
COMPARE
Chippewa
Creek
Family Poverty
Family Poverty Comparison
Chippewa
Creek
11.2%
FAMILY POVERTY
0.1/ 100
METRIC RATING
277th/ 347
METRIC RANK
11.7%
FAMILY POVERTY
0.0/ 100
METRIC RATING
297th/ 347
METRIC RANK
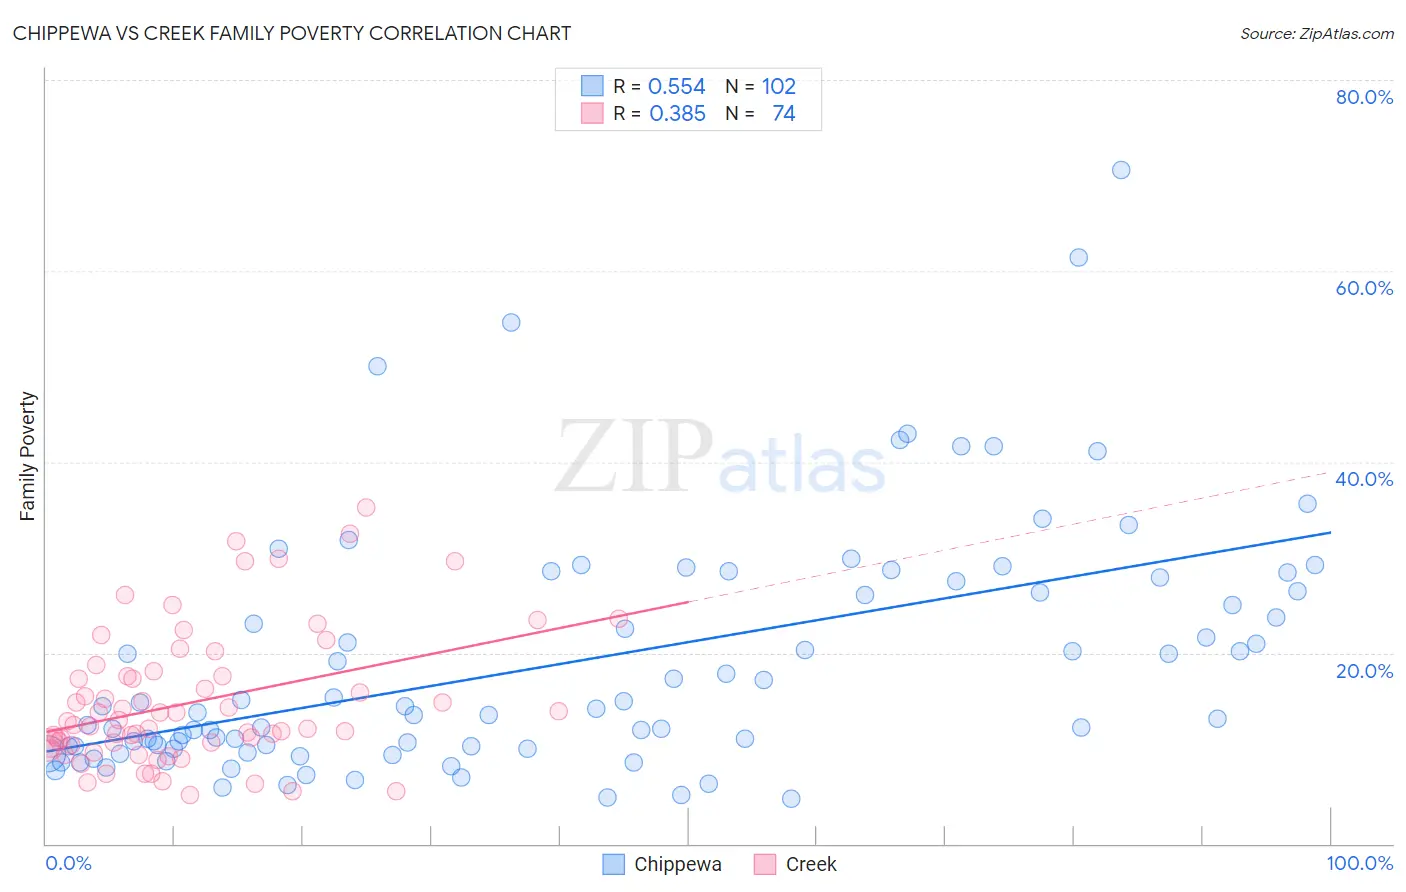
Chippewa vs Creek Family Poverty Correlation Chart
The statistical analysis conducted on geographies consisting of 214,735,331 people shows a substantial positive correlation between the proportion of Chippewa and poverty level among families in the United States with a correlation coefficient (R) of 0.554 and weighted average of 11.2%. Similarly, the statistical analysis conducted on geographies consisting of 178,327,636 people shows a mild positive correlation between the proportion of Creek and poverty level among families in the United States with a correlation coefficient (R) of 0.385 and weighted average of 11.7%, a difference of 3.7%.
Family Poverty Correlation Summary
| Measurement | Chippewa | Creek |
| Minimum | 4.7% | 5.1% |
| Maximum | 70.6% | 35.2% |
| Range | 65.9% | 30.1% |
| Mean | 19.0% | 14.8% |
| Median | 14.0% | 12.6% |
| Interquartile 25% (IQ1) | 10.2% | 10.4% |
| Interquartile 75% (IQ3) | 26.5% | 17.6% |
| Interquartile Range (IQR) | 16.3% | 7.2% |
| Standard Deviation (Sample) | 12.8% | 7.0% |
| Standard Deviation (Population) | 12.7% | 6.9% |
Demographics Similar to Chippewa and Creek by Family Poverty
In terms of family poverty, the demographic groups most similar to Chippewa are Guyanese (11.2%, a difference of 0.030%), Blackfeet (11.3%, a difference of 0.16%), Belizean (11.3%, a difference of 0.21%), Immigrants from West Indies (11.3%, a difference of 0.48%), and Immigrants from Cuba (11.3%, a difference of 0.74%). Similarly, the demographic groups most similar to Creek are Choctaw (11.6%, a difference of 0.23%), Immigrants from Haiti (11.6%, a difference of 0.28%), Immigrants from St. Vincent and the Grenadines (11.6%, a difference of 0.41%), Immigrants from Cabo Verde (11.6%, a difference of 0.49%), and Immigrants from Somalia (11.5%, a difference of 0.92%).
| Demographics | Rating | Rank | Family Poverty |
| Chippewa | 0.1 /100 | #277 | Tragic 11.2% |
| Guyanese | 0.1 /100 | #278 | Tragic 11.2% |
| Blackfeet | 0.0 /100 | #279 | Tragic 11.3% |
| Belizeans | 0.0 /100 | #280 | Tragic 11.3% |
| Immigrants | West Indies | 0.0 /100 | #281 | Tragic 11.3% |
| Immigrants | Cuba | 0.0 /100 | #282 | Tragic 11.3% |
| Indonesians | 0.0 /100 | #283 | Tragic 11.3% |
| Yaqui | 0.0 /100 | #284 | Tragic 11.3% |
| Barbadians | 0.0 /100 | #285 | Tragic 11.3% |
| Senegalese | 0.0 /100 | #286 | Tragic 11.5% |
| Vietnamese | 0.0 /100 | #287 | Tragic 11.5% |
| Immigrants | Belize | 0.0 /100 | #288 | Tragic 11.5% |
| Immigrants | Barbados | 0.0 /100 | #289 | Tragic 11.5% |
| West Indians | 0.0 /100 | #290 | Tragic 11.5% |
| Haitians | 0.0 /100 | #291 | Tragic 11.5% |
| Immigrants | Somalia | 0.0 /100 | #292 | Tragic 11.5% |
| Immigrants | Cabo Verde | 0.0 /100 | #293 | Tragic 11.6% |
| Immigrants | St. Vincent and the Grenadines | 0.0 /100 | #294 | Tragic 11.6% |
| Immigrants | Haiti | 0.0 /100 | #295 | Tragic 11.6% |
| Choctaw | 0.0 /100 | #296 | Tragic 11.6% |
| Creek | 0.0 /100 | #297 | Tragic 11.7% |