Cheyenne vs Welsh Single Female Poverty
COMPARE
Cheyenne
Welsh
Single Female Poverty
Single Female Poverty Comparison
Cheyenne
Welsh
30.4%
SINGLE FEMALE POVERTY
0.0/ 100
METRIC RATING
339th/ 347
METRIC RANK
22.0%
SINGLE FEMALE POVERTY
5.0/ 100
METRIC RATING
231st/ 347
METRIC RANK
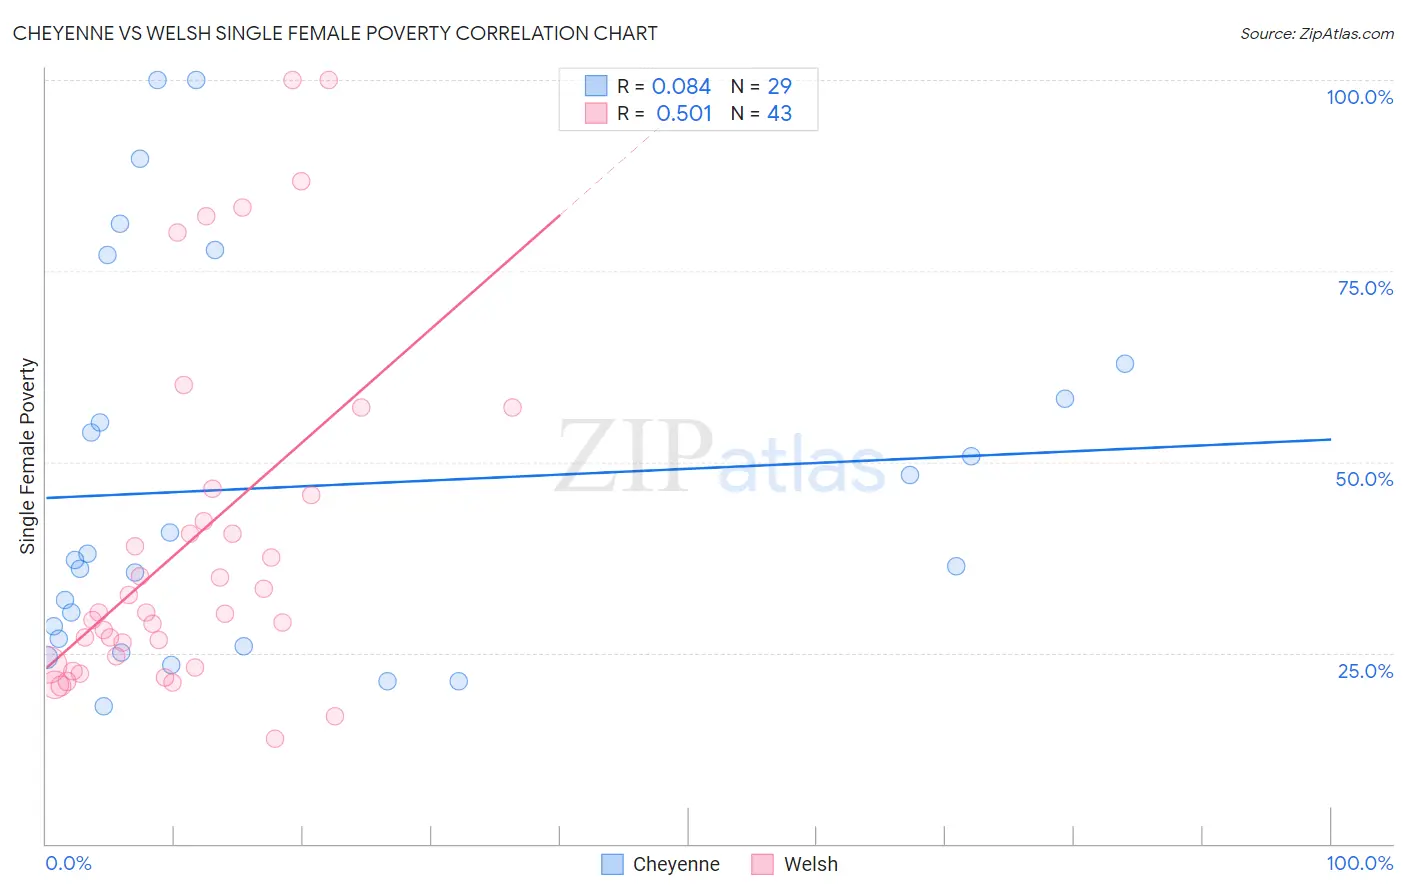
Cheyenne vs Welsh Single Female Poverty Correlation Chart
The statistical analysis conducted on geographies consisting of 80,467,038 people shows a slight positive correlation between the proportion of Cheyenne and poverty level among single females in the United States with a correlation coefficient (R) of 0.084 and weighted average of 30.4%. Similarly, the statistical analysis conducted on geographies consisting of 513,029,164 people shows a substantial positive correlation between the proportion of Welsh and poverty level among single females in the United States with a correlation coefficient (R) of 0.501 and weighted average of 22.0%, a difference of 38.4%.
Single Female Poverty Correlation Summary
| Measurement | Cheyenne | Welsh |
| Minimum | 18.0% | 13.7% |
| Maximum | 100.0% | 100.0% |
| Range | 82.0% | 86.3% |
| Mean | 46.7% | 39.5% |
| Median | 37.1% | 30.2% |
| Interquartile 25% (IQ1) | 26.3% | 23.5% |
| Interquartile 75% (IQ3) | 60.6% | 45.7% |
| Interquartile Range (IQR) | 34.3% | 22.3% |
| Standard Deviation (Sample) | 24.6% | 22.8% |
| Standard Deviation (Population) | 24.2% | 22.5% |
Similar Demographics by Single Female Poverty
Demographics Similar to Cheyenne by Single Female Poverty
In terms of single female poverty, the demographic groups most similar to Cheyenne are Pima (30.3%, a difference of 0.22%), Cajun (30.6%, a difference of 0.81%), Sioux (31.3%, a difference of 2.8%), Yuman (29.4%, a difference of 3.2%), and Navajo (31.7%, a difference of 4.1%).
| Demographics | Rating | Rank | Single Female Poverty |
| Yakama | 0.0 /100 | #332 | Tragic 28.3% |
| Ute | 0.0 /100 | #333 | Tragic 28.4% |
| Pueblo | 0.0 /100 | #334 | Tragic 28.6% |
| Immigrants | Yemen | 0.0 /100 | #335 | Tragic 28.9% |
| Colville | 0.0 /100 | #336 | Tragic 29.1% |
| Yuman | 0.0 /100 | #337 | Tragic 29.4% |
| Pima | 0.0 /100 | #338 | Tragic 30.3% |
| Cheyenne | 0.0 /100 | #339 | Tragic 30.4% |
| Cajuns | 0.0 /100 | #340 | Tragic 30.6% |
| Sioux | 0.0 /100 | #341 | Tragic 31.3% |
| Navajo | 0.0 /100 | #342 | Tragic 31.7% |
| Crow | 0.0 /100 | #343 | Tragic 32.4% |
| Lumbee | 0.0 /100 | #344 | Tragic 33.0% |
| Houma | 0.0 /100 | #345 | Tragic 33.8% |
| Puerto Ricans | 0.0 /100 | #346 | Tragic 34.1% |
Demographics Similar to Welsh by Single Female Poverty
In terms of single female poverty, the demographic groups most similar to Welsh are Immigrants from Thailand (22.0%, a difference of 0.010%), Immigrants from Western Africa (22.0%, a difference of 0.090%), Tlingit-Haida (21.9%, a difference of 0.11%), Spaniard (22.0%, a difference of 0.11%), and Spanish (22.0%, a difference of 0.11%).
| Demographics | Rating | Rank | Single Female Poverty |
| Barbadians | 7.2 /100 | #224 | Tragic 21.8% |
| English | 6.4 /100 | #225 | Tragic 21.9% |
| Immigrants | Portugal | 5.8 /100 | #226 | Tragic 21.9% |
| Immigrants | Ghana | 5.8 /100 | #227 | Tragic 21.9% |
| Salvadorans | 5.5 /100 | #228 | Tragic 21.9% |
| Tlingit-Haida | 5.4 /100 | #229 | Tragic 21.9% |
| Immigrants | Western Africa | 5.3 /100 | #230 | Tragic 22.0% |
| Welsh | 5.0 /100 | #231 | Tragic 22.0% |
| Immigrants | Thailand | 5.0 /100 | #232 | Tragic 22.0% |
| Spaniards | 4.7 /100 | #233 | Tragic 22.0% |
| Spanish | 4.7 /100 | #234 | Tragic 22.0% |
| Dutch | 4.6 /100 | #235 | Tragic 22.0% |
| Immigrants | Ecuador | 4.2 /100 | #236 | Tragic 22.0% |
| Vietnamese | 4.0 /100 | #237 | Tragic 22.0% |
| French Canadians | 2.8 /100 | #238 | Tragic 22.2% |