Cheyenne vs Indian (Asian) Single Female Poverty
COMPARE
Cheyenne
Indian (Asian)
Single Female Poverty
Single Female Poverty Comparison
Cheyenne
Indians (Asian)
30.4%
SINGLE FEMALE POVERTY
0.0/ 100
METRIC RATING
339th/ 347
METRIC RANK
17.9%
SINGLE FEMALE POVERTY
100.0/ 100
METRIC RATING
15th/ 347
METRIC RANK
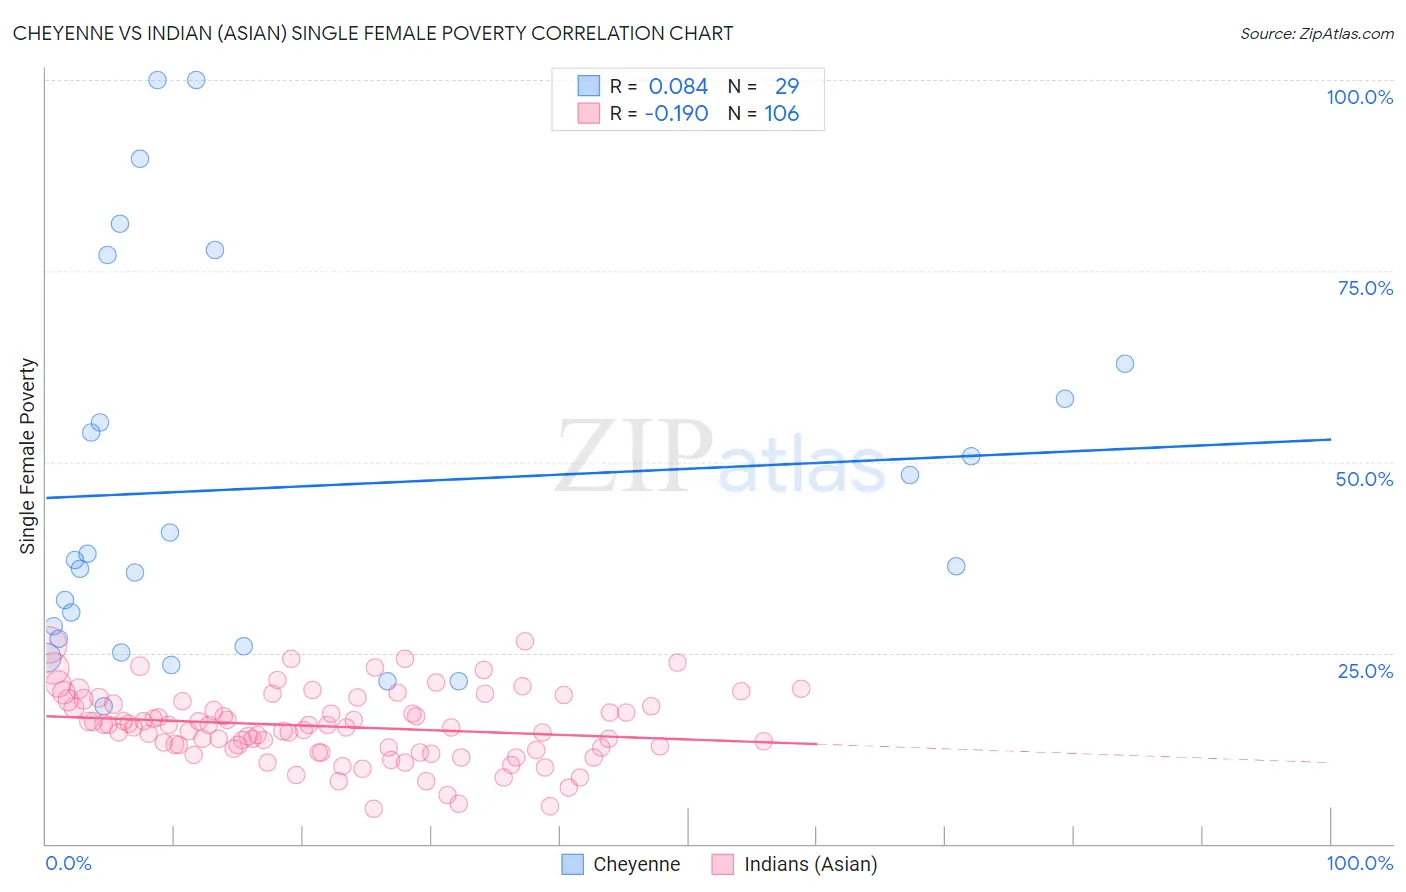
Cheyenne vs Indian (Asian) Single Female Poverty Correlation Chart
The statistical analysis conducted on geographies consisting of 80,467,038 people shows a slight positive correlation between the proportion of Cheyenne and poverty level among single females in the United States with a correlation coefficient (R) of 0.084 and weighted average of 30.4%. Similarly, the statistical analysis conducted on geographies consisting of 483,253,971 people shows a poor negative correlation between the proportion of Indians (Asian) and poverty level among single females in the United States with a correlation coefficient (R) of -0.190 and weighted average of 17.9%, a difference of 69.4%.
Single Female Poverty Correlation Summary
| Measurement | Cheyenne | Indian (Asian) |
| Minimum | 18.0% | 4.6% |
| Maximum | 100.0% | 26.6% |
| Range | 82.0% | 21.9% |
| Mean | 46.7% | 15.3% |
| Median | 37.1% | 15.4% |
| Interquartile 25% (IQ1) | 26.3% | 12.4% |
| Interquartile 75% (IQ3) | 60.6% | 18.6% |
| Interquartile Range (IQR) | 34.3% | 6.2% |
| Standard Deviation (Sample) | 24.6% | 4.6% |
| Standard Deviation (Population) | 24.2% | 4.6% |
Similar Demographics by Single Female Poverty
Demographics Similar to Cheyenne by Single Female Poverty
In terms of single female poverty, the demographic groups most similar to Cheyenne are Pima (30.3%, a difference of 0.22%), Cajun (30.6%, a difference of 0.81%), Sioux (31.3%, a difference of 2.8%), Yuman (29.4%, a difference of 3.2%), and Navajo (31.7%, a difference of 4.1%).
| Demographics | Rating | Rank | Single Female Poverty |
| Yakama | 0.0 /100 | #332 | Tragic 28.3% |
| Ute | 0.0 /100 | #333 | Tragic 28.4% |
| Pueblo | 0.0 /100 | #334 | Tragic 28.6% |
| Immigrants | Yemen | 0.0 /100 | #335 | Tragic 28.9% |
| Colville | 0.0 /100 | #336 | Tragic 29.1% |
| Yuman | 0.0 /100 | #337 | Tragic 29.4% |
| Pima | 0.0 /100 | #338 | Tragic 30.3% |
| Cheyenne | 0.0 /100 | #339 | Tragic 30.4% |
| Cajuns | 0.0 /100 | #340 | Tragic 30.6% |
| Sioux | 0.0 /100 | #341 | Tragic 31.3% |
| Navajo | 0.0 /100 | #342 | Tragic 31.7% |
| Crow | 0.0 /100 | #343 | Tragic 32.4% |
| Lumbee | 0.0 /100 | #344 | Tragic 33.0% |
| Houma | 0.0 /100 | #345 | Tragic 33.8% |
| Puerto Ricans | 0.0 /100 | #346 | Tragic 34.1% |
Demographics Similar to Indians (Asian) by Single Female Poverty
In terms of single female poverty, the demographic groups most similar to Indians (Asian) are Bolivian (17.9%, a difference of 0.15%), Iranian (18.0%, a difference of 0.16%), Immigrants from Bolivia (17.8%, a difference of 0.59%), Immigrants from Korea (18.1%, a difference of 0.76%), and Immigrants from South Central Asia (17.8%, a difference of 0.85%).
| Demographics | Rating | Rank | Single Female Poverty |
| Immigrants | Iran | 100.0 /100 | #8 | Exceptional 17.5% |
| Bhutanese | 100.0 /100 | #9 | Exceptional 17.7% |
| Immigrants | Ireland | 100.0 /100 | #10 | Exceptional 17.8% |
| Immigrants | Lithuania | 100.0 /100 | #11 | Exceptional 17.8% |
| Immigrants | South Central Asia | 100.0 /100 | #12 | Exceptional 17.8% |
| Immigrants | Bolivia | 100.0 /100 | #13 | Exceptional 17.8% |
| Bolivians | 100.0 /100 | #14 | Exceptional 17.9% |
| Indians (Asian) | 100.0 /100 | #15 | Exceptional 17.9% |
| Iranians | 100.0 /100 | #16 | Exceptional 18.0% |
| Immigrants | Korea | 100.0 /100 | #17 | Exceptional 18.1% |
| Immigrants | Eastern Asia | 100.0 /100 | #18 | Exceptional 18.1% |
| Immigrants | China | 100.0 /100 | #19 | Exceptional 18.1% |
| Immigrants | Greece | 100.0 /100 | #20 | Exceptional 18.3% |
| Maltese | 100.0 /100 | #21 | Exceptional 18.3% |
| Burmese | 100.0 /100 | #22 | Exceptional 18.3% |