Cambodian vs Paiute Single Mother Poverty
COMPARE
Cambodian
Paiute
Single Mother Poverty
Single Mother Poverty Comparison
Cambodians
Paiute
27.0%
SINGLE MOTHER POVERTY
99.8/ 100
METRIC RATING
49th/ 347
METRIC RANK
35.1%
SINGLE MOTHER POVERTY
0.0/ 100
METRIC RATING
321st/ 347
METRIC RANK
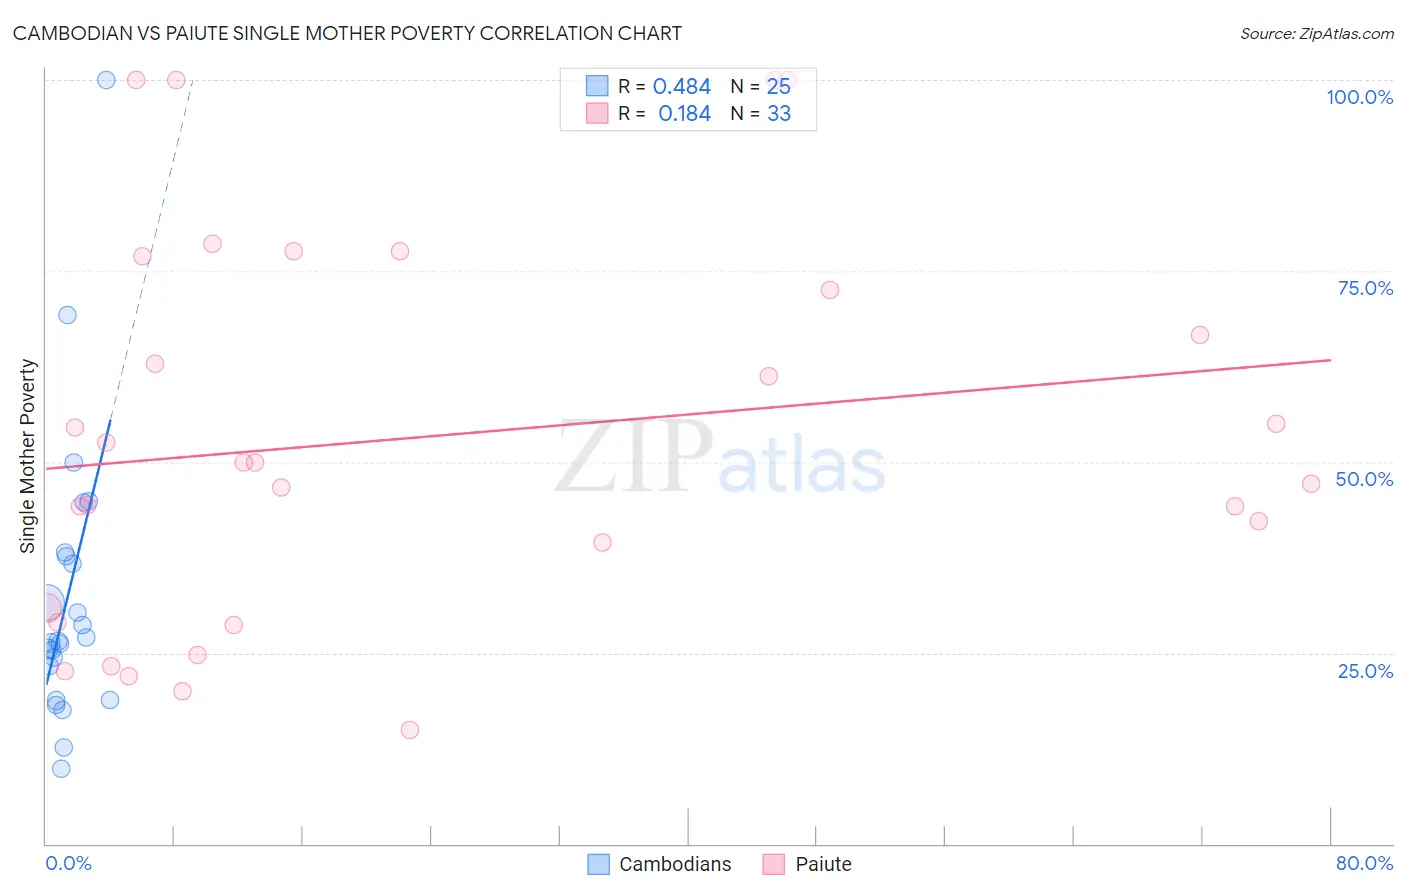
Cambodian vs Paiute Single Mother Poverty Correlation Chart
The statistical analysis conducted on geographies consisting of 101,772,823 people shows a moderate positive correlation between the proportion of Cambodians and poverty level among single mothers in the United States with a correlation coefficient (R) of 0.484 and weighted average of 27.0%. Similarly, the statistical analysis conducted on geographies consisting of 58,096,720 people shows a poor positive correlation between the proportion of Paiute and poverty level among single mothers in the United States with a correlation coefficient (R) of 0.184 and weighted average of 35.1%, a difference of 30.4%.
Single Mother Poverty Correlation Summary
| Measurement | Cambodian | Paiute |
| Minimum | 9.8% | 14.8% |
| Maximum | 100.0% | 100.0% |
| Range | 90.2% | 85.2% |
| Mean | 32.5% | 53.3% |
| Median | 26.5% | 50.0% |
| Interquartile 25% (IQ1) | 21.0% | 29.9% |
| Interquartile 75% (IQ3) | 37.8% | 74.7% |
| Interquartile Range (IQR) | 16.8% | 44.8% |
| Standard Deviation (Sample) | 19.1% | 25.3% |
| Standard Deviation (Population) | 18.7% | 24.9% |
Similar Demographics by Single Mother Poverty
Demographics Similar to Cambodians by Single Mother Poverty
In terms of single mother poverty, the demographic groups most similar to Cambodians are Laotian (27.0%, a difference of 0.010%), Immigrants from Poland (26.9%, a difference of 0.080%), Egyptian (26.9%, a difference of 0.16%), Immigrants from Serbia (26.9%, a difference of 0.22%), and Latvian (26.9%, a difference of 0.26%).
| Demographics | Rating | Rank | Single Mother Poverty |
| Armenians | 99.9 /100 | #42 | Exceptional 26.8% |
| Tsimshian | 99.9 /100 | #43 | Exceptional 26.8% |
| Immigrants | Sierra Leone | 99.9 /100 | #44 | Exceptional 26.9% |
| Latvians | 99.9 /100 | #45 | Exceptional 26.9% |
| Immigrants | Serbia | 99.9 /100 | #46 | Exceptional 26.9% |
| Egyptians | 99.8 /100 | #47 | Exceptional 26.9% |
| Immigrants | Poland | 99.8 /100 | #48 | Exceptional 26.9% |
| Cambodians | 99.8 /100 | #49 | Exceptional 27.0% |
| Laotians | 99.8 /100 | #50 | Exceptional 27.0% |
| Immigrants | Argentina | 99.7 /100 | #51 | Exceptional 27.1% |
| Immigrants | South Eastern Asia | 99.7 /100 | #52 | Exceptional 27.1% |
| Immigrants | Jordan | 99.7 /100 | #53 | Exceptional 27.1% |
| Immigrants | Bulgaria | 99.7 /100 | #54 | Exceptional 27.1% |
| Immigrants | Egypt | 99.7 /100 | #55 | Exceptional 27.1% |
| Immigrants | Romania | 99.7 /100 | #56 | Exceptional 27.2% |
Demographics Similar to Paiute by Single Mother Poverty
In terms of single mother poverty, the demographic groups most similar to Paiute are Black/African American (35.2%, a difference of 0.20%), Iroquois (34.8%, a difference of 0.87%), Kiowa (35.5%, a difference of 0.91%), Chippewa (34.8%, a difference of 1.1%), and Ottawa (35.5%, a difference of 1.1%).
| Demographics | Rating | Rank | Single Mother Poverty |
| Chickasaw | 0.0 /100 | #314 | Tragic 34.4% |
| Hopi | 0.0 /100 | #315 | Tragic 34.5% |
| Dominicans | 0.0 /100 | #316 | Tragic 34.5% |
| Cherokee | 0.0 /100 | #317 | Tragic 34.5% |
| Immigrants | Honduras | 0.0 /100 | #318 | Tragic 34.7% |
| Chippewa | 0.0 /100 | #319 | Tragic 34.8% |
| Iroquois | 0.0 /100 | #320 | Tragic 34.8% |
| Paiute | 0.0 /100 | #321 | Tragic 35.1% |
| Blacks/African Americans | 0.0 /100 | #322 | Tragic 35.2% |
| Kiowa | 0.0 /100 | #323 | Tragic 35.5% |
| Ottawa | 0.0 /100 | #324 | Tragic 35.5% |
| Ute | 0.0 /100 | #325 | Tragic 35.7% |
| Seminole | 0.0 /100 | #326 | Tragic 35.8% |
| Yakama | 0.0 /100 | #327 | Tragic 36.4% |
| Choctaw | 0.0 /100 | #328 | Tragic 36.4% |