Cambodian vs Nepalese Single Mother Poverty
COMPARE
Cambodian
Nepalese
Single Mother Poverty
Single Mother Poverty Comparison
Cambodians
Nepalese
27.0%
SINGLE MOTHER POVERTY
99.8/ 100
METRIC RATING
49th/ 347
METRIC RANK
29.3%
SINGLE MOTHER POVERTY
38.3/ 100
METRIC RATING
183rd/ 347
METRIC RANK
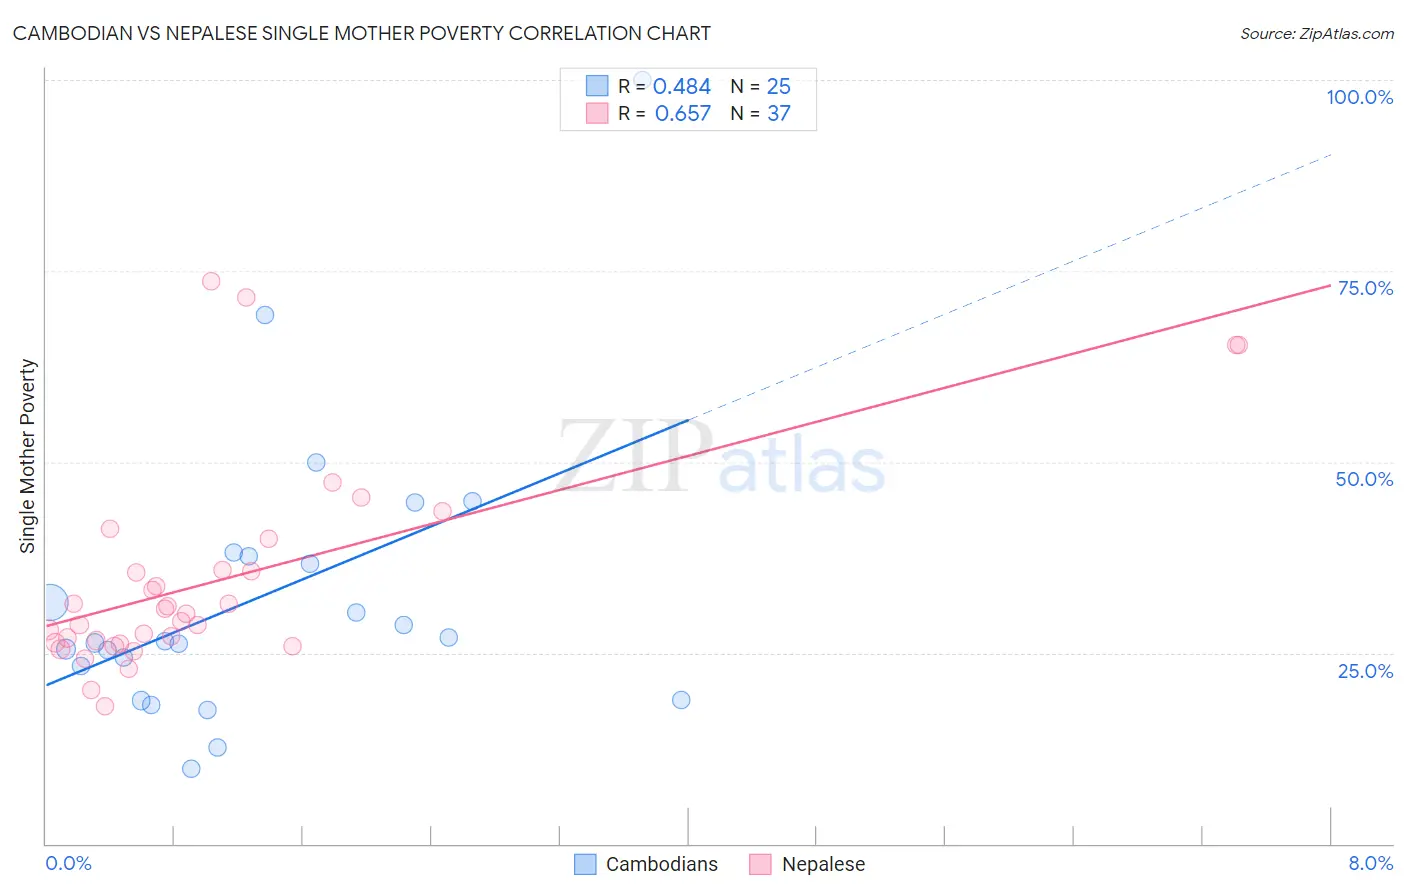
Cambodian vs Nepalese Single Mother Poverty Correlation Chart
The statistical analysis conducted on geographies consisting of 101,772,823 people shows a moderate positive correlation between the proportion of Cambodians and poverty level among single mothers in the United States with a correlation coefficient (R) of 0.484 and weighted average of 27.0%. Similarly, the statistical analysis conducted on geographies consisting of 24,439,991 people shows a significant positive correlation between the proportion of Nepalese and poverty level among single mothers in the United States with a correlation coefficient (R) of 0.657 and weighted average of 29.3%, a difference of 8.8%.
Single Mother Poverty Correlation Summary
| Measurement | Cambodian | Nepalese |
| Minimum | 9.8% | 17.9% |
| Maximum | 100.0% | 73.6% |
| Range | 90.2% | 55.7% |
| Mean | 32.5% | 34.7% |
| Median | 26.5% | 30.1% |
| Interquartile 25% (IQ1) | 21.0% | 26.3% |
| Interquartile 75% (IQ3) | 37.8% | 37.9% |
| Interquartile Range (IQR) | 16.8% | 11.7% |
| Standard Deviation (Sample) | 19.1% | 13.8% |
| Standard Deviation (Population) | 18.7% | 13.6% |
Similar Demographics by Single Mother Poverty
Demographics Similar to Cambodians by Single Mother Poverty
In terms of single mother poverty, the demographic groups most similar to Cambodians are Laotian (27.0%, a difference of 0.010%), Immigrants from Poland (26.9%, a difference of 0.080%), Egyptian (26.9%, a difference of 0.16%), Immigrants from Serbia (26.9%, a difference of 0.22%), and Latvian (26.9%, a difference of 0.26%).
| Demographics | Rating | Rank | Single Mother Poverty |
| Armenians | 99.9 /100 | #42 | Exceptional 26.8% |
| Tsimshian | 99.9 /100 | #43 | Exceptional 26.8% |
| Immigrants | Sierra Leone | 99.9 /100 | #44 | Exceptional 26.9% |
| Latvians | 99.9 /100 | #45 | Exceptional 26.9% |
| Immigrants | Serbia | 99.9 /100 | #46 | Exceptional 26.9% |
| Egyptians | 99.8 /100 | #47 | Exceptional 26.9% |
| Immigrants | Poland | 99.8 /100 | #48 | Exceptional 26.9% |
| Cambodians | 99.8 /100 | #49 | Exceptional 27.0% |
| Laotians | 99.8 /100 | #50 | Exceptional 27.0% |
| Immigrants | Argentina | 99.7 /100 | #51 | Exceptional 27.1% |
| Immigrants | South Eastern Asia | 99.7 /100 | #52 | Exceptional 27.1% |
| Immigrants | Jordan | 99.7 /100 | #53 | Exceptional 27.1% |
| Immigrants | Bulgaria | 99.7 /100 | #54 | Exceptional 27.1% |
| Immigrants | Egypt | 99.7 /100 | #55 | Exceptional 27.1% |
| Immigrants | Romania | 99.7 /100 | #56 | Exceptional 27.2% |
Demographics Similar to Nepalese by Single Mother Poverty
In terms of single mother poverty, the demographic groups most similar to Nepalese are Immigrants from Eastern Africa (29.3%, a difference of 0.010%), Nigerian (29.3%, a difference of 0.010%), Ghanaian (29.4%, a difference of 0.070%), Canadian (29.3%, a difference of 0.11%), and Yugoslavian (29.4%, a difference of 0.11%).
| Demographics | Rating | Rank | Single Mother Poverty |
| Hawaiians | 47.8 /100 | #176 | Average 29.2% |
| Immigrants | Bosnia and Herzegovina | 45.1 /100 | #177 | Average 29.2% |
| South American Indians | 43.2 /100 | #178 | Average 29.3% |
| Immigrants | Uzbekistan | 42.6 /100 | #179 | Average 29.3% |
| Immigrants | Norway | 41.5 /100 | #180 | Average 29.3% |
| Canadians | 40.4 /100 | #181 | Average 29.3% |
| Immigrants | Eastern Africa | 38.5 /100 | #182 | Fair 29.3% |
| Nepalese | 38.3 /100 | #183 | Fair 29.3% |
| Nigerians | 38.0 /100 | #184 | Fair 29.3% |
| Ghanaians | 36.8 /100 | #185 | Fair 29.4% |
| Yugoslavians | 36.0 /100 | #186 | Fair 29.4% |
| Lebanese | 32.5 /100 | #187 | Fair 29.4% |
| Guamanians/Chamorros | 31.8 /100 | #188 | Fair 29.4% |
| Immigrants | Africa | 31.6 /100 | #189 | Fair 29.4% |
| Immigrants | Germany | 30.4 /100 | #190 | Fair 29.5% |