Cambodian vs German Russian Single Mother Poverty
COMPARE
Cambodian
German Russian
Single Mother Poverty
Single Mother Poverty Comparison
Cambodians
German Russians
27.0%
SINGLE MOTHER POVERTY
99.8/ 100
METRIC RATING
49th/ 347
METRIC RANK
31.3%
SINGLE MOTHER POVERTY
0.2/ 100
METRIC RATING
265th/ 347
METRIC RANK
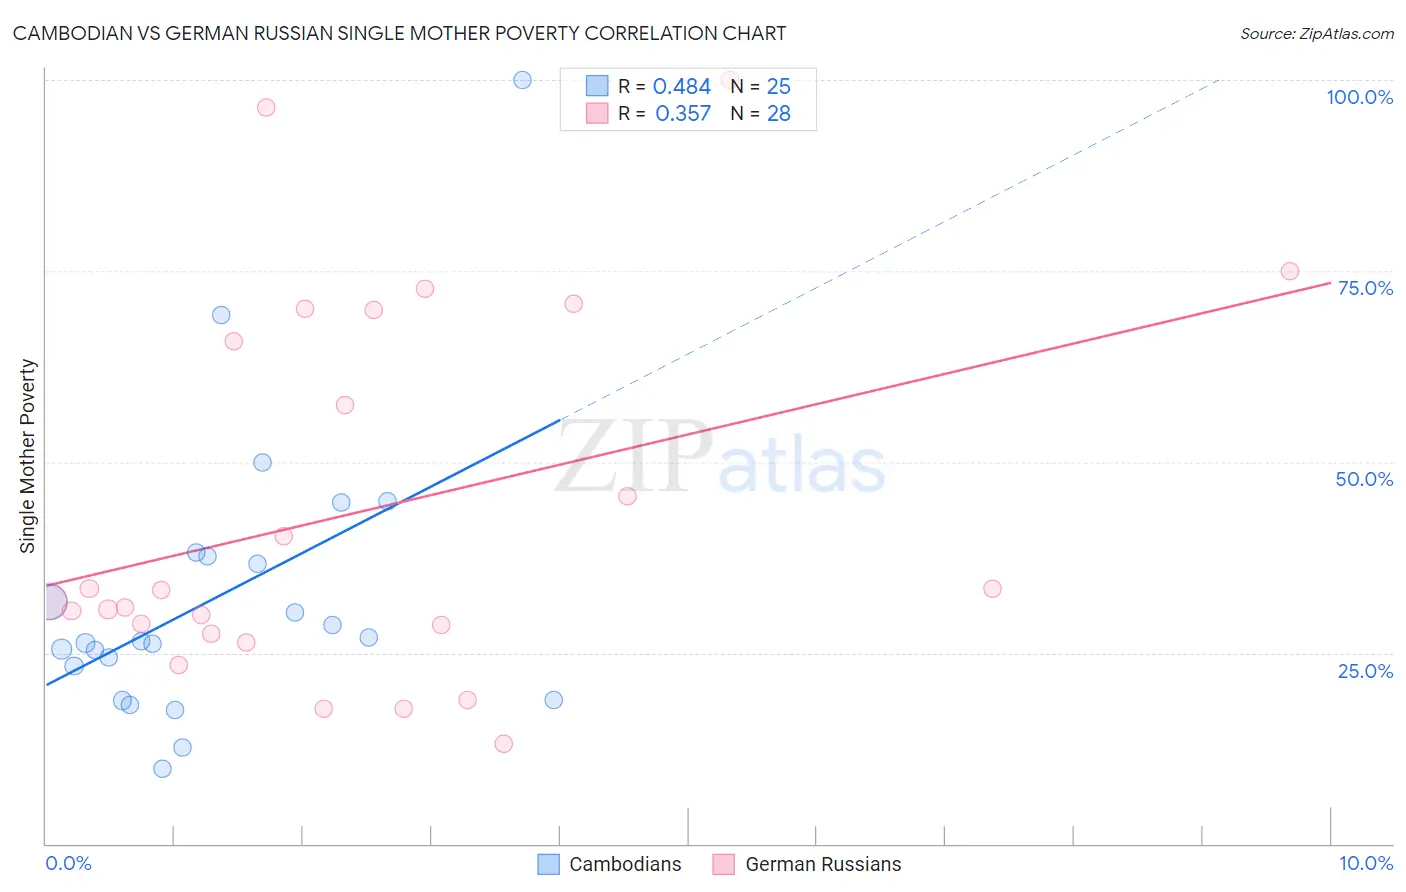
Cambodian vs German Russian Single Mother Poverty Correlation Chart
The statistical analysis conducted on geographies consisting of 101,772,823 people shows a moderate positive correlation between the proportion of Cambodians and poverty level among single mothers in the United States with a correlation coefficient (R) of 0.484 and weighted average of 27.0%. Similarly, the statistical analysis conducted on geographies consisting of 95,920,640 people shows a mild positive correlation between the proportion of German Russians and poverty level among single mothers in the United States with a correlation coefficient (R) of 0.357 and weighted average of 31.3%, a difference of 16.3%.
Single Mother Poverty Correlation Summary
| Measurement | Cambodian | German Russian |
| Minimum | 9.8% | 13.1% |
| Maximum | 100.0% | 100.0% |
| Range | 90.2% | 86.9% |
| Mean | 32.5% | 43.6% |
| Median | 26.5% | 32.5% |
| Interquartile 25% (IQ1) | 21.0% | 28.1% |
| Interquartile 75% (IQ3) | 37.8% | 67.9% |
| Interquartile Range (IQR) | 16.8% | 39.8% |
| Standard Deviation (Sample) | 19.1% | 24.4% |
| Standard Deviation (Population) | 18.7% | 24.0% |
Similar Demographics by Single Mother Poverty
Demographics Similar to Cambodians by Single Mother Poverty
In terms of single mother poverty, the demographic groups most similar to Cambodians are Laotian (27.0%, a difference of 0.010%), Immigrants from Poland (26.9%, a difference of 0.080%), Egyptian (26.9%, a difference of 0.16%), Immigrants from Serbia (26.9%, a difference of 0.22%), and Latvian (26.9%, a difference of 0.26%).
| Demographics | Rating | Rank | Single Mother Poverty |
| Armenians | 99.9 /100 | #42 | Exceptional 26.8% |
| Tsimshian | 99.9 /100 | #43 | Exceptional 26.8% |
| Immigrants | Sierra Leone | 99.9 /100 | #44 | Exceptional 26.9% |
| Latvians | 99.9 /100 | #45 | Exceptional 26.9% |
| Immigrants | Serbia | 99.9 /100 | #46 | Exceptional 26.9% |
| Egyptians | 99.8 /100 | #47 | Exceptional 26.9% |
| Immigrants | Poland | 99.8 /100 | #48 | Exceptional 26.9% |
| Cambodians | 99.8 /100 | #49 | Exceptional 27.0% |
| Laotians | 99.8 /100 | #50 | Exceptional 27.0% |
| Immigrants | Argentina | 99.7 /100 | #51 | Exceptional 27.1% |
| Immigrants | South Eastern Asia | 99.7 /100 | #52 | Exceptional 27.1% |
| Immigrants | Jordan | 99.7 /100 | #53 | Exceptional 27.1% |
| Immigrants | Bulgaria | 99.7 /100 | #54 | Exceptional 27.1% |
| Immigrants | Egypt | 99.7 /100 | #55 | Exceptional 27.1% |
| Immigrants | Romania | 99.7 /100 | #56 | Exceptional 27.2% |
Demographics Similar to German Russians by Single Mother Poverty
In terms of single mother poverty, the demographic groups most similar to German Russians are Immigrants from Ecuador (31.3%, a difference of 0.030%), Bahamian (31.3%, a difference of 0.040%), Subsaharan African (31.4%, a difference of 0.070%), Immigrants from Belize (31.4%, a difference of 0.22%), and Hmong (31.2%, a difference of 0.31%).
| Demographics | Rating | Rank | Single Mother Poverty |
| Immigrants | Caribbean | 0.4 /100 | #258 | Tragic 31.1% |
| Immigrants | Bangladesh | 0.4 /100 | #259 | Tragic 31.1% |
| Whites/Caucasians | 0.3 /100 | #260 | Tragic 31.2% |
| Immigrants | El Salvador | 0.3 /100 | #261 | Tragic 31.2% |
| Hmong | 0.3 /100 | #262 | Tragic 31.2% |
| Bahamians | 0.2 /100 | #263 | Tragic 31.3% |
| Immigrants | Ecuador | 0.2 /100 | #264 | Tragic 31.3% |
| German Russians | 0.2 /100 | #265 | Tragic 31.3% |
| Sub-Saharan Africans | 0.2 /100 | #266 | Tragic 31.4% |
| Immigrants | Belize | 0.2 /100 | #267 | Tragic 31.4% |
| Immigrants | Senegal | 0.1 /100 | #268 | Tragic 31.5% |
| Scotch-Irish | 0.1 /100 | #269 | Tragic 31.5% |
| British West Indians | 0.1 /100 | #270 | Tragic 31.5% |
| Immigrants | Cabo Verde | 0.1 /100 | #271 | Tragic 31.6% |
| Immigrants | Micronesia | 0.1 /100 | #272 | Tragic 31.6% |