Burmese vs South American Single Father Poverty
COMPARE
Burmese
South American
Single Father Poverty
Single Father Poverty Comparison
Burmese
South Americans
15.5%
SINGLE FATHER POVERTY
99.0/ 100
METRIC RATING
88th/ 347
METRIC RANK
16.0%
SINGLE FATHER POVERTY
85.9/ 100
METRIC RATING
139th/ 347
METRIC RANK
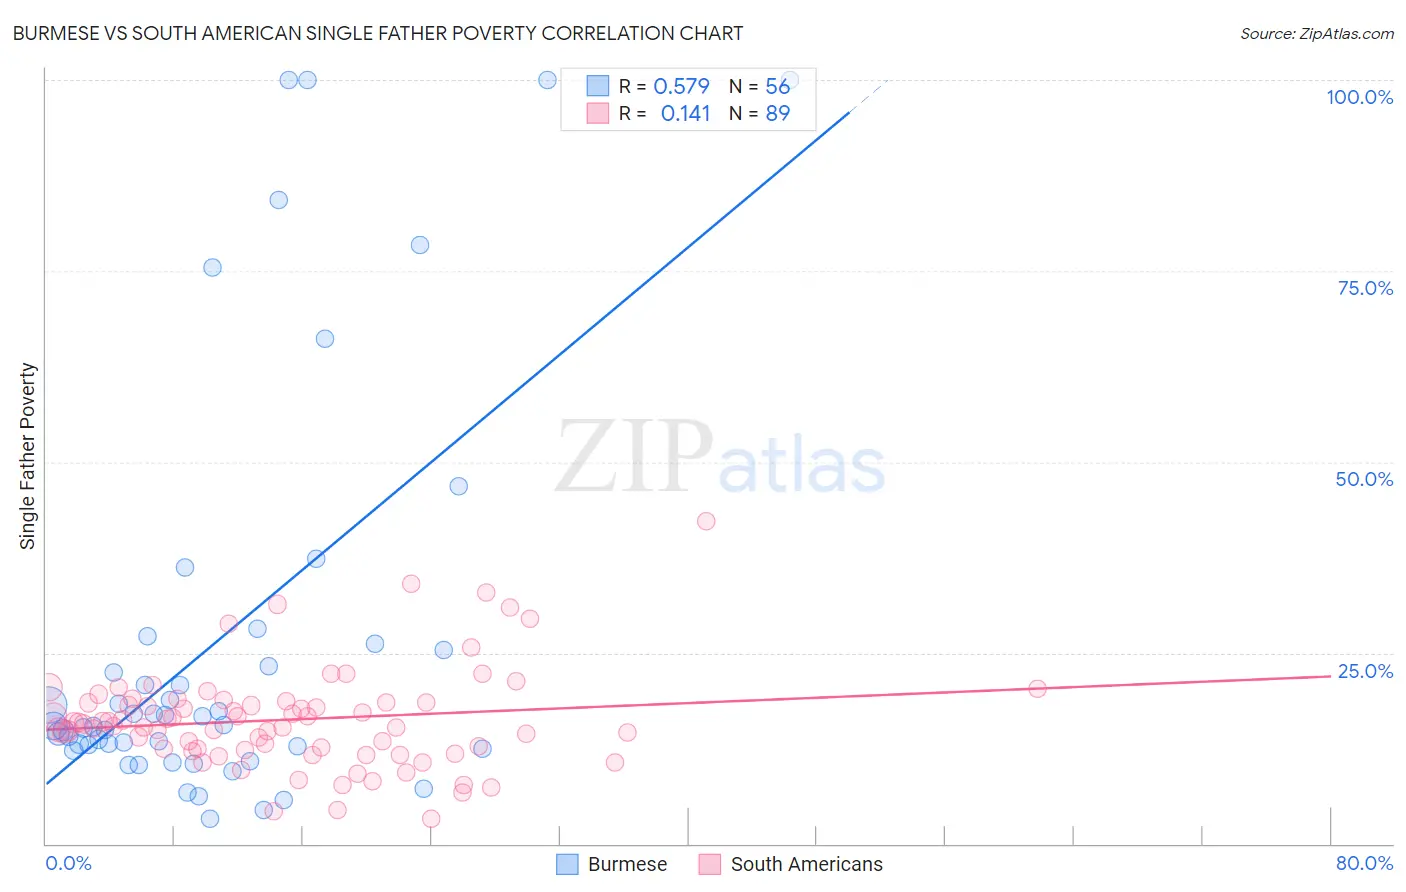
Burmese vs South American Single Father Poverty Correlation Chart
The statistical analysis conducted on geographies consisting of 355,001,827 people shows a substantial positive correlation between the proportion of Burmese and poverty level among single fathers in the United States with a correlation coefficient (R) of 0.579 and weighted average of 15.5%. Similarly, the statistical analysis conducted on geographies consisting of 374,519,857 people shows a poor positive correlation between the proportion of South Americans and poverty level among single fathers in the United States with a correlation coefficient (R) of 0.141 and weighted average of 16.0%, a difference of 3.3%.
Single Father Poverty Correlation Summary
| Measurement | Burmese | South American |
| Minimum | 3.2% | 3.2% |
| Maximum | 100.0% | 42.3% |
| Range | 96.8% | 39.1% |
| Mean | 26.6% | 16.2% |
| Median | 15.4% | 15.7% |
| Interquartile 25% (IQ1) | 12.7% | 12.3% |
| Interquartile 75% (IQ3) | 25.9% | 18.6% |
| Interquartile Range (IQR) | 13.2% | 6.3% |
| Standard Deviation (Sample) | 26.9% | 6.6% |
| Standard Deviation (Population) | 26.7% | 6.6% |
Similar Demographics by Single Father Poverty
Demographics Similar to Burmese by Single Father Poverty
In terms of single father poverty, the demographic groups most similar to Burmese are Brazilian (15.5%, a difference of 0.030%), Immigrants from Russia (15.5%, a difference of 0.040%), Immigrants from Korea (15.5%, a difference of 0.060%), Immigrants from Oceania (15.4%, a difference of 0.16%), and Peruvian (15.4%, a difference of 0.28%).
| Demographics | Rating | Rank | Single Father Poverty |
| Immigrants | Congo | 99.4 /100 | #81 | Exceptional 15.4% |
| Immigrants | Ukraine | 99.4 /100 | #82 | Exceptional 15.4% |
| Chinese | 99.3 /100 | #83 | Exceptional 15.4% |
| Peruvians | 99.2 /100 | #84 | Exceptional 15.4% |
| Immigrants | Oceania | 99.1 /100 | #85 | Exceptional 15.4% |
| Immigrants | Russia | 99.0 /100 | #86 | Exceptional 15.5% |
| Brazilians | 99.0 /100 | #87 | Exceptional 15.5% |
| Burmese | 99.0 /100 | #88 | Exceptional 15.5% |
| Immigrants | Korea | 99.0 /100 | #89 | Exceptional 15.5% |
| Mexican American Indians | 98.7 /100 | #90 | Exceptional 15.5% |
| Immigrants | Romania | 98.6 /100 | #91 | Exceptional 15.5% |
| Immigrants | Serbia | 98.5 /100 | #92 | Exceptional 15.5% |
| Basques | 98.4 /100 | #93 | Exceptional 15.5% |
| Immigrants | Uruguay | 98.2 /100 | #94 | Exceptional 15.6% |
| Immigrants | Kazakhstan | 98.2 /100 | #95 | Exceptional 15.6% |
Demographics Similar to South Americans by Single Father Poverty
In terms of single father poverty, the demographic groups most similar to South Americans are Immigrants from Netherlands (16.0%, a difference of 0.050%), Central American (16.0%, a difference of 0.12%), Immigrants from the Azores (15.9%, a difference of 0.13%), Cypriot (15.9%, a difference of 0.16%), and Liberian (16.0%, a difference of 0.22%).
| Demographics | Rating | Rank | Single Father Poverty |
| Immigrants | Portugal | 89.7 /100 | #132 | Excellent 15.9% |
| Immigrants | Syria | 89.5 /100 | #133 | Excellent 15.9% |
| Immigrants | South America | 88.5 /100 | #134 | Excellent 15.9% |
| Immigrants | Sri Lanka | 88.2 /100 | #135 | Excellent 15.9% |
| Cypriots | 87.5 /100 | #136 | Excellent 15.9% |
| Immigrants | Azores | 87.2 /100 | #137 | Excellent 15.9% |
| Central Americans | 87.1 /100 | #138 | Excellent 16.0% |
| South Americans | 85.9 /100 | #139 | Excellent 16.0% |
| Immigrants | Netherlands | 85.3 /100 | #140 | Excellent 16.0% |
| Liberians | 83.3 /100 | #141 | Excellent 16.0% |
| Immigrants | Mexico | 83.3 /100 | #142 | Excellent 16.0% |
| Immigrants | Central America | 83.1 /100 | #143 | Excellent 16.0% |
| Immigrants | Kuwait | 81.4 /100 | #144 | Excellent 16.0% |
| Immigrants | Western Asia | 80.7 /100 | #145 | Excellent 16.0% |
| Immigrants | Hungary | 78.3 /100 | #146 | Good 16.1% |