Slovene vs South American Single Father Poverty
COMPARE
Slovene
South American
Single Father Poverty
Single Father Poverty Comparison
Slovenes
South Americans
17.3%
SINGLE FATHER POVERTY
0.3/ 100
METRIC RATING
264th/ 347
METRIC RANK
16.0%
SINGLE FATHER POVERTY
85.9/ 100
METRIC RATING
139th/ 347
METRIC RANK
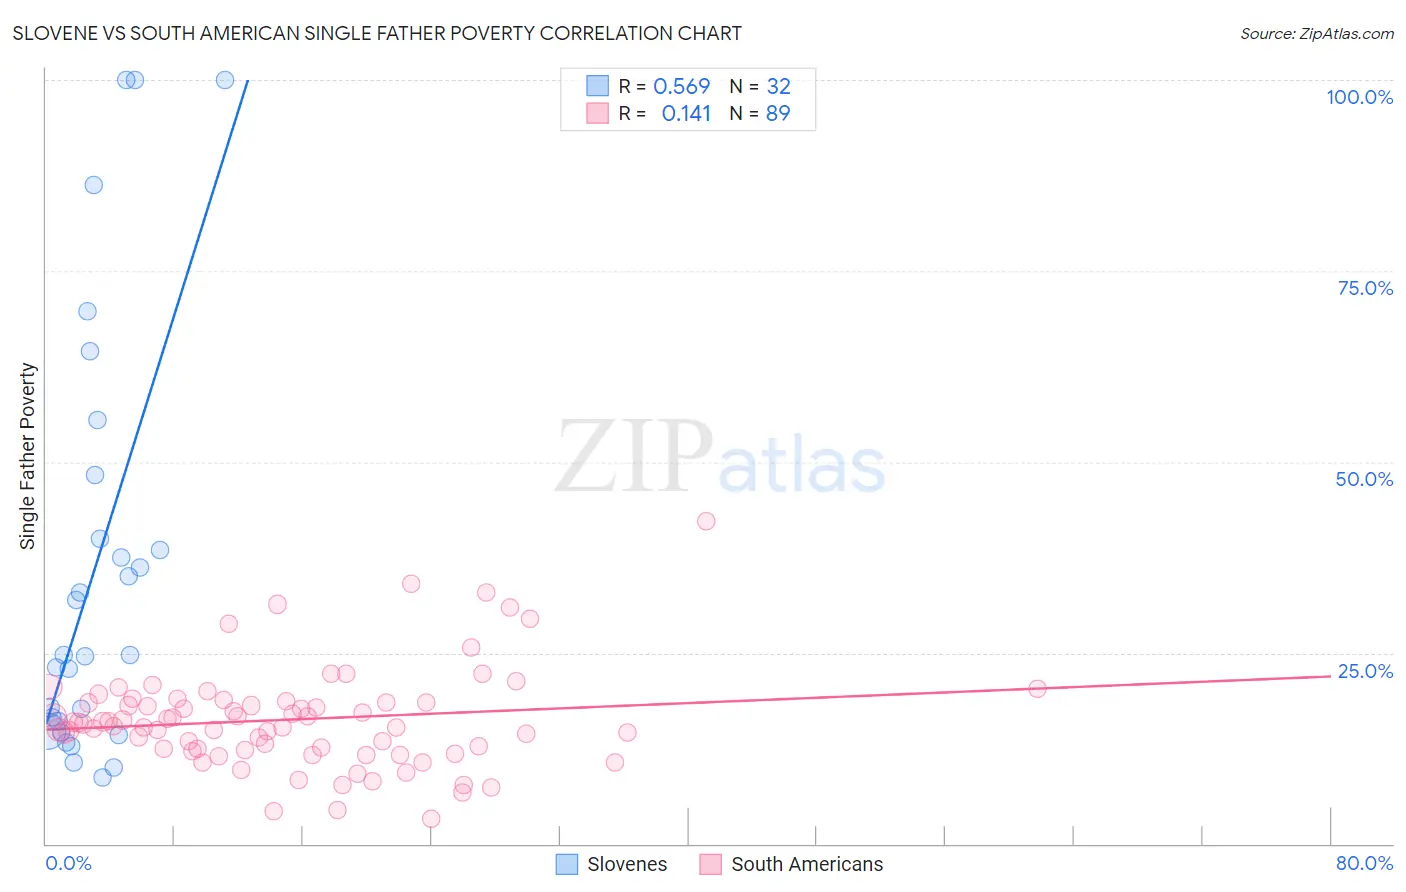
Slovene vs South American Single Father Poverty Correlation Chart
The statistical analysis conducted on geographies consisting of 209,649,531 people shows a substantial positive correlation between the proportion of Slovenes and poverty level among single fathers in the United States with a correlation coefficient (R) of 0.569 and weighted average of 17.3%. Similarly, the statistical analysis conducted on geographies consisting of 374,519,857 people shows a poor positive correlation between the proportion of South Americans and poverty level among single fathers in the United States with a correlation coefficient (R) of 0.141 and weighted average of 16.0%, a difference of 8.5%.
Single Father Poverty Correlation Summary
| Measurement | Slovene | South American |
| Minimum | 8.6% | 3.2% |
| Maximum | 100.0% | 42.3% |
| Range | 91.4% | 39.1% |
| Mean | 36.3% | 16.2% |
| Median | 24.8% | 15.7% |
| Interquartile 25% (IQ1) | 15.4% | 12.3% |
| Interquartile 75% (IQ3) | 44.1% | 18.6% |
| Interquartile Range (IQR) | 28.7% | 6.3% |
| Standard Deviation (Sample) | 27.8% | 6.6% |
| Standard Deviation (Population) | 27.4% | 6.6% |
Similar Demographics by Single Father Poverty
Demographics Similar to Slovenes by Single Father Poverty
In terms of single father poverty, the demographic groups most similar to Slovenes are Polish (17.3%, a difference of 0.0%), Jamaican (17.3%, a difference of 0.060%), Haitian (17.3%, a difference of 0.10%), Lithuanian (17.3%, a difference of 0.20%), and Immigrants from Caribbean (17.4%, a difference of 0.20%).
| Demographics | Rating | Rank | Single Father Poverty |
| Immigrants | Albania | 0.7 /100 | #257 | Tragic 17.2% |
| Albanians | 0.7 /100 | #258 | Tragic 17.2% |
| Immigrants | Jamaica | 0.7 /100 | #259 | Tragic 17.2% |
| Spaniards | 0.6 /100 | #260 | Tragic 17.2% |
| Swiss | 0.5 /100 | #261 | Tragic 17.3% |
| Immigrants | Zaire | 0.4 /100 | #262 | Tragic 17.3% |
| Lithuanians | 0.4 /100 | #263 | Tragic 17.3% |
| Slovenes | 0.3 /100 | #264 | Tragic 17.3% |
| Poles | 0.3 /100 | #265 | Tragic 17.3% |
| Jamaicans | 0.3 /100 | #266 | Tragic 17.3% |
| Haitians | 0.3 /100 | #267 | Tragic 17.3% |
| Immigrants | Caribbean | 0.3 /100 | #268 | Tragic 17.4% |
| Slavs | 0.3 /100 | #269 | Tragic 17.4% |
| Indonesians | 0.2 /100 | #270 | Tragic 17.4% |
| French American Indians | 0.2 /100 | #271 | Tragic 17.4% |
Demographics Similar to South Americans by Single Father Poverty
In terms of single father poverty, the demographic groups most similar to South Americans are Immigrants from Netherlands (16.0%, a difference of 0.050%), Central American (16.0%, a difference of 0.12%), Immigrants from the Azores (15.9%, a difference of 0.13%), Cypriot (15.9%, a difference of 0.16%), and Liberian (16.0%, a difference of 0.22%).
| Demographics | Rating | Rank | Single Father Poverty |
| Immigrants | Portugal | 89.7 /100 | #132 | Excellent 15.9% |
| Immigrants | Syria | 89.5 /100 | #133 | Excellent 15.9% |
| Immigrants | South America | 88.5 /100 | #134 | Excellent 15.9% |
| Immigrants | Sri Lanka | 88.2 /100 | #135 | Excellent 15.9% |
| Cypriots | 87.5 /100 | #136 | Excellent 15.9% |
| Immigrants | Azores | 87.2 /100 | #137 | Excellent 15.9% |
| Central Americans | 87.1 /100 | #138 | Excellent 16.0% |
| South Americans | 85.9 /100 | #139 | Excellent 16.0% |
| Immigrants | Netherlands | 85.3 /100 | #140 | Excellent 16.0% |
| Liberians | 83.3 /100 | #141 | Excellent 16.0% |
| Immigrants | Mexico | 83.3 /100 | #142 | Excellent 16.0% |
| Immigrants | Central America | 83.1 /100 | #143 | Excellent 16.0% |
| Immigrants | Kuwait | 81.4 /100 | #144 | Excellent 16.0% |
| Immigrants | Western Asia | 80.7 /100 | #145 | Excellent 16.0% |
| Immigrants | Hungary | 78.3 /100 | #146 | Good 16.1% |