Burmese vs Immigrants from Austria Poverty
COMPARE
Burmese
Immigrants from Austria
Poverty
Poverty Comparison
Burmese
Immigrants from Austria
10.7%
POVERTY
99.6/ 100
METRIC RATING
26th/ 347
METRIC RANK
11.1%
POVERTY
98.6/ 100
METRIC RATING
53rd/ 347
METRIC RANK
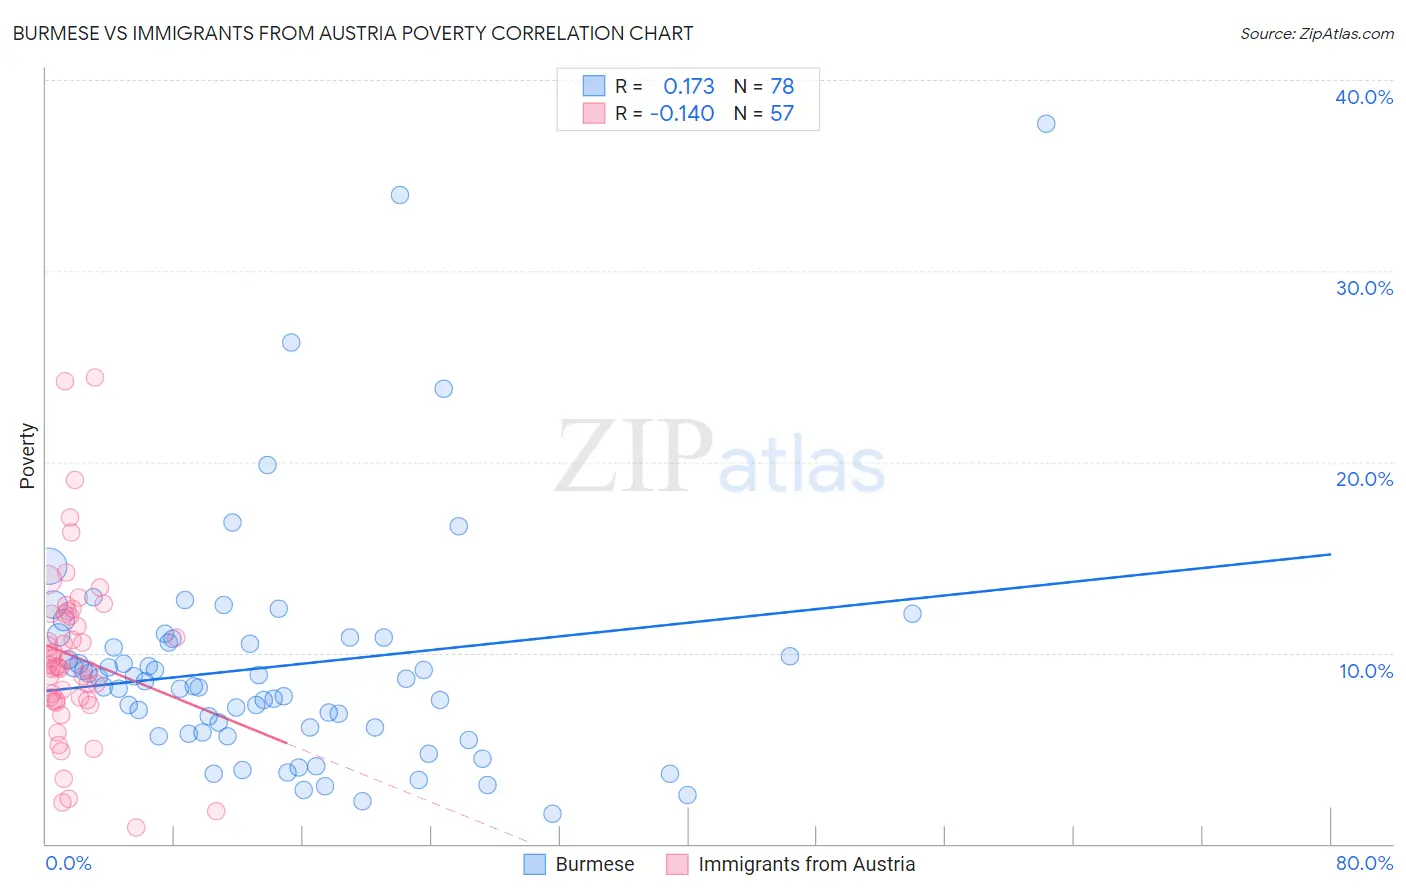
Burmese vs Immigrants from Austria Poverty Correlation Chart
The statistical analysis conducted on geographies consisting of 464,896,901 people shows a poor positive correlation between the proportion of Burmese and poverty level in the United States with a correlation coefficient (R) of 0.173 and weighted average of 10.7%. Similarly, the statistical analysis conducted on geographies consisting of 167,938,578 people shows a poor negative correlation between the proportion of Immigrants from Austria and poverty level in the United States with a correlation coefficient (R) of -0.140 and weighted average of 11.1%, a difference of 3.6%.
Poverty Correlation Summary
| Measurement | Burmese | Immigrants from Austria |
| Minimum | 1.6% | 0.88% |
| Maximum | 37.7% | 24.4% |
| Range | 36.2% | 23.6% |
| Mean | 9.3% | 9.8% |
| Median | 8.4% | 9.3% |
| Interquartile 25% (IQ1) | 5.8% | 7.5% |
| Interquartile 75% (IQ3) | 10.8% | 12.1% |
| Interquartile Range (IQR) | 4.9% | 4.5% |
| Standard Deviation (Sample) | 6.2% | 4.5% |
| Standard Deviation (Population) | 6.1% | 4.5% |
Similar Demographics by Poverty
Demographics Similar to Burmese by Poverty
In terms of poverty, the demographic groups most similar to Burmese are Croatian (10.6%, a difference of 0.31%), Immigrants from Northern Europe (10.7%, a difference of 0.36%), Immigrants from Korea (10.7%, a difference of 0.42%), Italian (10.6%, a difference of 0.50%), and Greek (10.7%, a difference of 0.52%).
| Demographics | Rating | Rank | Poverty |
| Immigrants | Scotland | 99.7 /100 | #19 | Exceptional 10.6% |
| Immigrants | North Macedonia | 99.7 /100 | #20 | Exceptional 10.6% |
| Luxembourgers | 99.7 /100 | #21 | Exceptional 10.6% |
| Eastern Europeans | 99.7 /100 | #22 | Exceptional 10.6% |
| Swedes | 99.7 /100 | #23 | Exceptional 10.6% |
| Italians | 99.7 /100 | #24 | Exceptional 10.6% |
| Croatians | 99.6 /100 | #25 | Exceptional 10.6% |
| Burmese | 99.6 /100 | #26 | Exceptional 10.7% |
| Immigrants | Northern Europe | 99.6 /100 | #27 | Exceptional 10.7% |
| Immigrants | Korea | 99.5 /100 | #28 | Exceptional 10.7% |
| Greeks | 99.5 /100 | #29 | Exceptional 10.7% |
| Danes | 99.5 /100 | #30 | Exceptional 10.7% |
| Poles | 99.5 /100 | #31 | Exceptional 10.7% |
| Iranians | 99.5 /100 | #32 | Exceptional 10.7% |
| Macedonians | 99.4 /100 | #33 | Exceptional 10.8% |
Demographics Similar to Immigrants from Austria by Poverty
In terms of poverty, the demographic groups most similar to Immigrants from Austria are Immigrants from Bulgaria (11.1%, a difference of 0.12%), Immigrants from Serbia (11.1%, a difference of 0.15%), Immigrants from Philippines (11.0%, a difference of 0.23%), Immigrants from Croatia (11.0%, a difference of 0.24%), and Estonian (11.1%, a difference of 0.63%).
| Demographics | Rating | Rank | Poverty |
| Immigrants | Czechoslovakia | 98.9 /100 | #46 | Exceptional 11.0% |
| Immigrants | Romania | 98.9 /100 | #47 | Exceptional 11.0% |
| Slovenes | 98.9 /100 | #48 | Exceptional 11.0% |
| Immigrants | Japan | 98.9 /100 | #49 | Exceptional 11.0% |
| Asians | 98.9 /100 | #50 | Exceptional 11.0% |
| Immigrants | Croatia | 98.7 /100 | #51 | Exceptional 11.0% |
| Immigrants | Philippines | 98.7 /100 | #52 | Exceptional 11.0% |
| Immigrants | Austria | 98.6 /100 | #53 | Exceptional 11.1% |
| Immigrants | Bulgaria | 98.5 /100 | #54 | Exceptional 11.1% |
| Immigrants | Serbia | 98.5 /100 | #55 | Exceptional 11.1% |
| Estonians | 98.2 /100 | #56 | Exceptional 11.1% |
| Scandinavians | 98.2 /100 | #57 | Exceptional 11.1% |
| Germans | 98.1 /100 | #58 | Exceptional 11.1% |
| Immigrants | Europe | 98.0 /100 | #59 | Exceptional 11.2% |
| Immigrants | Sri Lanka | 97.9 /100 | #60 | Exceptional 11.2% |