Burmese vs Immigrants from Austria Average Family Size
COMPARE
Burmese
Immigrants from Austria
Average Family Size
Average Family Size Comparison
Burmese
Immigrants from Austria
3.22
AVERAGE FAMILY SIZE
31.0/ 100
METRIC RATING
190th/ 347
METRIC RANK
3.12
AVERAGE FAMILY SIZE
0.0/ 100
METRIC RATING
321st/ 347
METRIC RANK
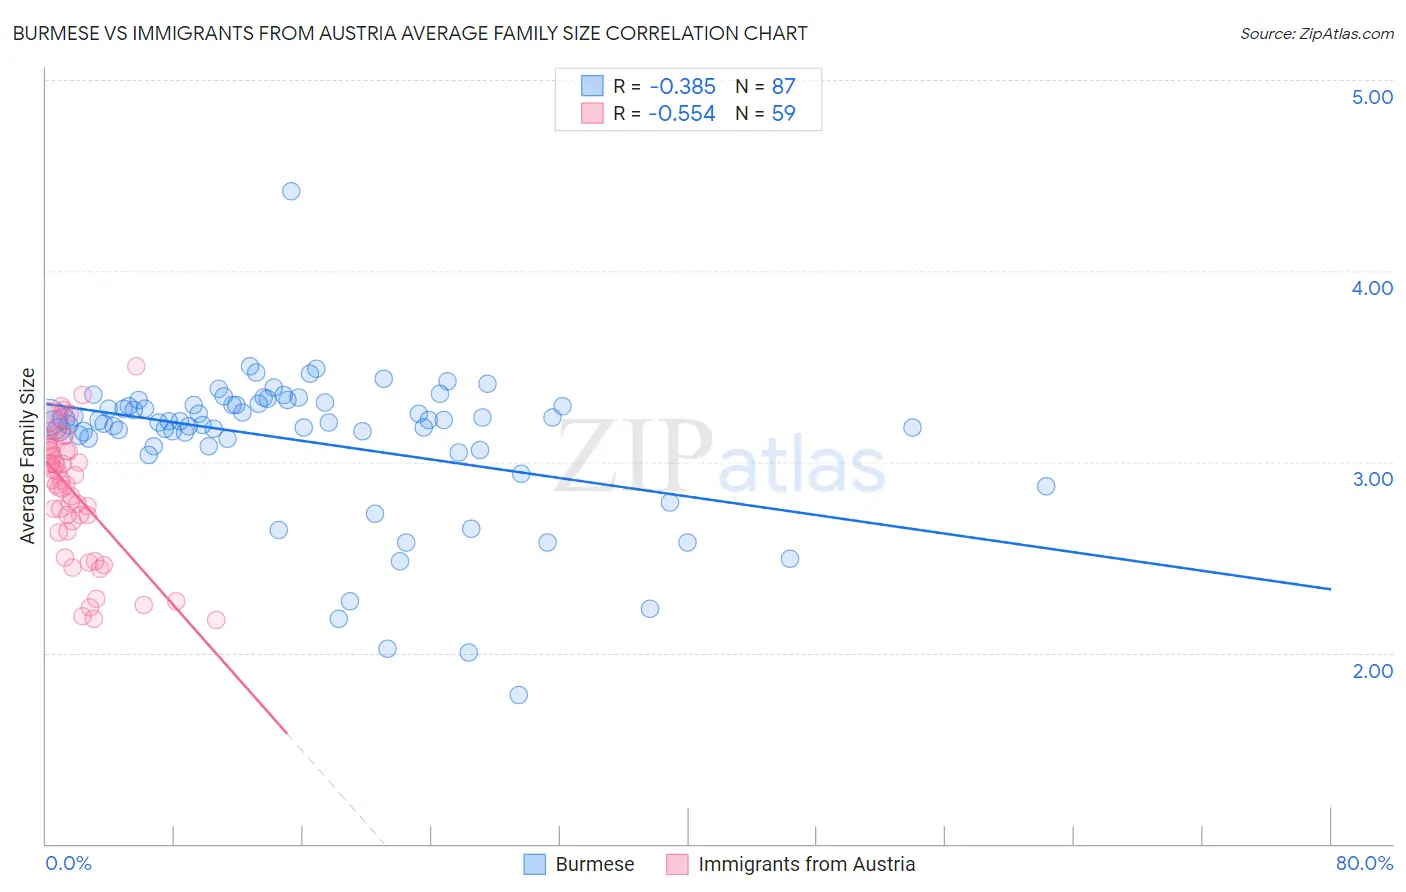
Burmese vs Immigrants from Austria Average Family Size Correlation Chart
The statistical analysis conducted on geographies consisting of 464,897,225 people shows a mild negative correlation between the proportion of Burmese and average family size in the United States with a correlation coefficient (R) of -0.385 and weighted average of 3.22. Similarly, the statistical analysis conducted on geographies consisting of 167,966,875 people shows a substantial negative correlation between the proportion of Immigrants from Austria and average family size in the United States with a correlation coefficient (R) of -0.554 and weighted average of 3.12, a difference of 3.2%.
Average Family Size Correlation Summary
| Measurement | Burmese | Immigrants from Austria |
| Minimum | 1.78 | 2.17 |
| Maximum | 4.42 | 3.50 |
| Range | 2.64 | 1.33 |
| Mean | 3.11 | 2.84 |
| Median | 3.21 | 2.90 |
| Interquartile 25% (IQ1) | 3.08 | 2.64 |
| Interquartile 75% (IQ3) | 3.30 | 3.06 |
| Interquartile Range (IQR) | 0.22 | 0.43 |
| Standard Deviation (Sample) | 0.39 | 0.33 |
| Standard Deviation (Population) | 0.38 | 0.32 |
Similar Demographics by Average Family Size
Demographics Similar to Burmese by Average Family Size
In terms of average family size, the demographic groups most similar to Burmese are Immigrants from Zaire (3.22, a difference of 0.010%), Immigrants from Eastern Africa (3.22, a difference of 0.020%), Immigrants from Israel (3.22, a difference of 0.040%), Immigrants from Sudan (3.22, a difference of 0.040%), and Pakistani (3.22, a difference of 0.060%).
| Demographics | Rating | Rank | Average Family Size |
| Immigrants | Northern Africa | 41.7 /100 | #183 | Average 3.22 |
| Immigrants | Eastern Asia | 40.8 /100 | #184 | Average 3.22 |
| Immigrants | Sri Lanka | 39.8 /100 | #185 | Fair 3.22 |
| Immigrants | Argentina | 39.8 /100 | #186 | Fair 3.22 |
| Immigrants | Malaysia | 39.0 /100 | #187 | Fair 3.22 |
| Thais | 38.3 /100 | #188 | Fair 3.22 |
| Pakistanis | 33.7 /100 | #189 | Fair 3.22 |
| Burmese | 31.0 /100 | #190 | Fair 3.22 |
| Immigrants | Zaire | 30.5 /100 | #191 | Fair 3.22 |
| Immigrants | Eastern Africa | 30.1 /100 | #192 | Fair 3.22 |
| Immigrants | Israel | 29.3 /100 | #193 | Fair 3.22 |
| Immigrants | Sudan | 29.1 /100 | #194 | Fair 3.22 |
| Choctaw | 28.3 /100 | #195 | Fair 3.21 |
| Senegalese | 28.2 /100 | #196 | Fair 3.21 |
| Kenyans | 28.0 /100 | #197 | Fair 3.21 |
Demographics Similar to Immigrants from Austria by Average Family Size
In terms of average family size, the demographic groups most similar to Immigrants from Austria are Immigrants from Canada (3.12, a difference of 0.0%), Immigrants from North America (3.12, a difference of 0.030%), Soviet Union (3.11, a difference of 0.030%), Eastern European (3.12, a difference of 0.10%), and Welsh (3.12, a difference of 0.10%).
| Demographics | Rating | Rank | Average Family Size |
| Russians | 0.1 /100 | #314 | Tragic 3.12 |
| Immigrants | Scotland | 0.1 /100 | #315 | Tragic 3.12 |
| Serbians | 0.1 /100 | #316 | Tragic 3.12 |
| Italians | 0.1 /100 | #317 | Tragic 3.12 |
| Eastern Europeans | 0.1 /100 | #318 | Tragic 3.12 |
| Welsh | 0.1 /100 | #319 | Tragic 3.12 |
| Immigrants | North America | 0.0 /100 | #320 | Tragic 3.12 |
| Immigrants | Austria | 0.0 /100 | #321 | Tragic 3.12 |
| Immigrants | Canada | 0.0 /100 | #322 | Tragic 3.12 |
| Soviet Union | 0.0 /100 | #323 | Tragic 3.11 |
| Celtics | 0.0 /100 | #324 | Tragic 3.11 |
| English | 0.0 /100 | #325 | Tragic 3.11 |
| Ottawa | 0.0 /100 | #326 | Tragic 3.11 |
| Dutch | 0.0 /100 | #327 | Tragic 3.11 |
| Czechs | 0.0 /100 | #328 | Tragic 3.11 |