Burmese vs Bahamian Poverty
COMPARE
Burmese
Bahamian
Poverty
Poverty Comparison
Burmese
Bahamians
10.7%
POVERTY
99.6/ 100
METRIC RATING
26th/ 347
METRIC RANK
15.4%
POVERTY
0.0/ 100
METRIC RATING
301st/ 347
METRIC RANK
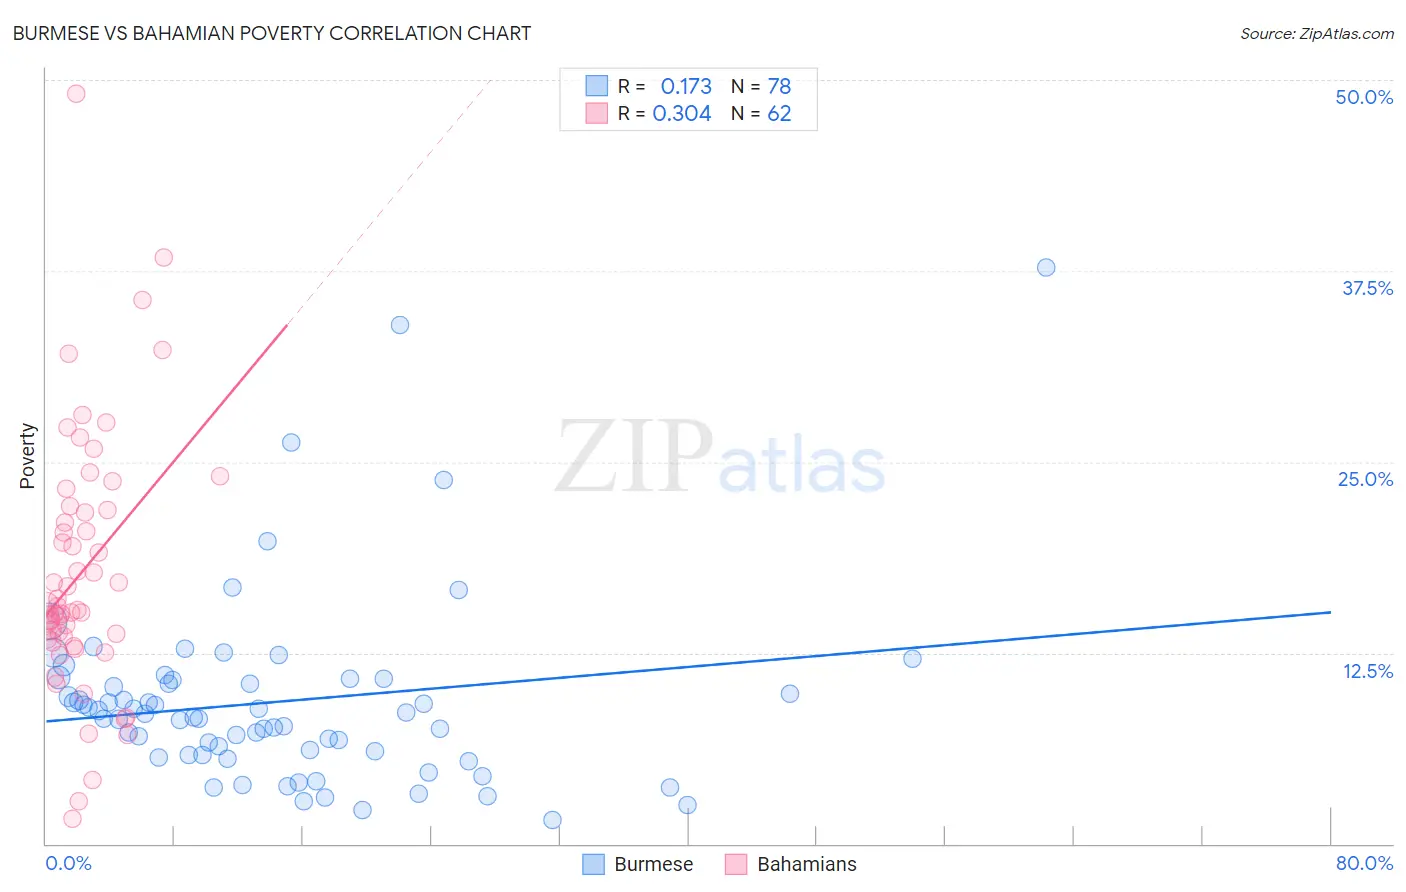
Burmese vs Bahamian Poverty Correlation Chart
The statistical analysis conducted on geographies consisting of 464,896,901 people shows a poor positive correlation between the proportion of Burmese and poverty level in the United States with a correlation coefficient (R) of 0.173 and weighted average of 10.7%. Similarly, the statistical analysis conducted on geographies consisting of 112,639,225 people shows a mild positive correlation between the proportion of Bahamians and poverty level in the United States with a correlation coefficient (R) of 0.304 and weighted average of 15.4%, a difference of 44.3%.
Poverty Correlation Summary
| Measurement | Burmese | Bahamian |
| Minimum | 1.6% | 1.7% |
| Maximum | 37.7% | 49.1% |
| Range | 36.2% | 47.4% |
| Mean | 9.3% | 17.8% |
| Median | 8.4% | 15.4% |
| Interquartile 25% (IQ1) | 5.8% | 13.4% |
| Interquartile 75% (IQ3) | 10.8% | 21.8% |
| Interquartile Range (IQR) | 4.9% | 8.4% |
| Standard Deviation (Sample) | 6.2% | 8.5% |
| Standard Deviation (Population) | 6.1% | 8.4% |
Similar Demographics by Poverty
Demographics Similar to Burmese by Poverty
In terms of poverty, the demographic groups most similar to Burmese are Croatian (10.6%, a difference of 0.31%), Immigrants from Northern Europe (10.7%, a difference of 0.36%), Immigrants from Korea (10.7%, a difference of 0.42%), Italian (10.6%, a difference of 0.50%), and Greek (10.7%, a difference of 0.52%).
| Demographics | Rating | Rank | Poverty |
| Immigrants | Scotland | 99.7 /100 | #19 | Exceptional 10.6% |
| Immigrants | North Macedonia | 99.7 /100 | #20 | Exceptional 10.6% |
| Luxembourgers | 99.7 /100 | #21 | Exceptional 10.6% |
| Eastern Europeans | 99.7 /100 | #22 | Exceptional 10.6% |
| Swedes | 99.7 /100 | #23 | Exceptional 10.6% |
| Italians | 99.7 /100 | #24 | Exceptional 10.6% |
| Croatians | 99.6 /100 | #25 | Exceptional 10.6% |
| Burmese | 99.6 /100 | #26 | Exceptional 10.7% |
| Immigrants | Northern Europe | 99.6 /100 | #27 | Exceptional 10.7% |
| Immigrants | Korea | 99.5 /100 | #28 | Exceptional 10.7% |
| Greeks | 99.5 /100 | #29 | Exceptional 10.7% |
| Danes | 99.5 /100 | #30 | Exceptional 10.7% |
| Poles | 99.5 /100 | #31 | Exceptional 10.7% |
| Iranians | 99.5 /100 | #32 | Exceptional 10.7% |
| Macedonians | 99.4 /100 | #33 | Exceptional 10.8% |
Demographics Similar to Bahamians by Poverty
In terms of poverty, the demographic groups most similar to Bahamians are Somali (15.4%, a difference of 0.13%), Immigrants from Central America (15.4%, a difference of 0.21%), Senegalese (15.3%, a difference of 0.59%), Immigrants from Caribbean (15.5%, a difference of 0.61%), and Immigrants from Senegal (15.3%, a difference of 0.68%).
| Demographics | Rating | Rank | Poverty |
| Blackfeet | 0.0 /100 | #294 | Tragic 15.2% |
| Guatemalans | 0.0 /100 | #295 | Tragic 15.3% |
| Hispanics or Latinos | 0.0 /100 | #296 | Tragic 15.3% |
| Immigrants | Bangladesh | 0.0 /100 | #297 | Tragic 15.3% |
| Immigrants | Senegal | 0.0 /100 | #298 | Tragic 15.3% |
| Senegalese | 0.0 /100 | #299 | Tragic 15.3% |
| Immigrants | Central America | 0.0 /100 | #300 | Tragic 15.4% |
| Bahamians | 0.0 /100 | #301 | Tragic 15.4% |
| Somalis | 0.0 /100 | #302 | Tragic 15.4% |
| Immigrants | Caribbean | 0.0 /100 | #303 | Tragic 15.5% |
| Immigrants | Mexico | 0.0 /100 | #304 | Tragic 15.5% |
| Immigrants | Guatemala | 0.0 /100 | #305 | Tragic 15.5% |
| Creek | 0.0 /100 | #306 | Tragic 15.6% |
| Africans | 0.0 /100 | #307 | Tragic 15.6% |
| Choctaw | 0.0 /100 | #308 | Tragic 15.6% |