Asian vs Egyptian Child Poverty Among Girls Under 16
COMPARE
Asian
Egyptian
Child Poverty Among Girls Under 16
Child Poverty Among Girls Under 16 Comparison
Asians
Egyptians
13.7%
CHILD POVERTY AMONG GIRLS UNDER 16
99.7/ 100
METRIC RATING
30th/ 347
METRIC RANK
14.7%
CHILD POVERTY AMONG GIRLS UNDER 16
97.9/ 100
METRIC RATING
80th/ 347
METRIC RANK
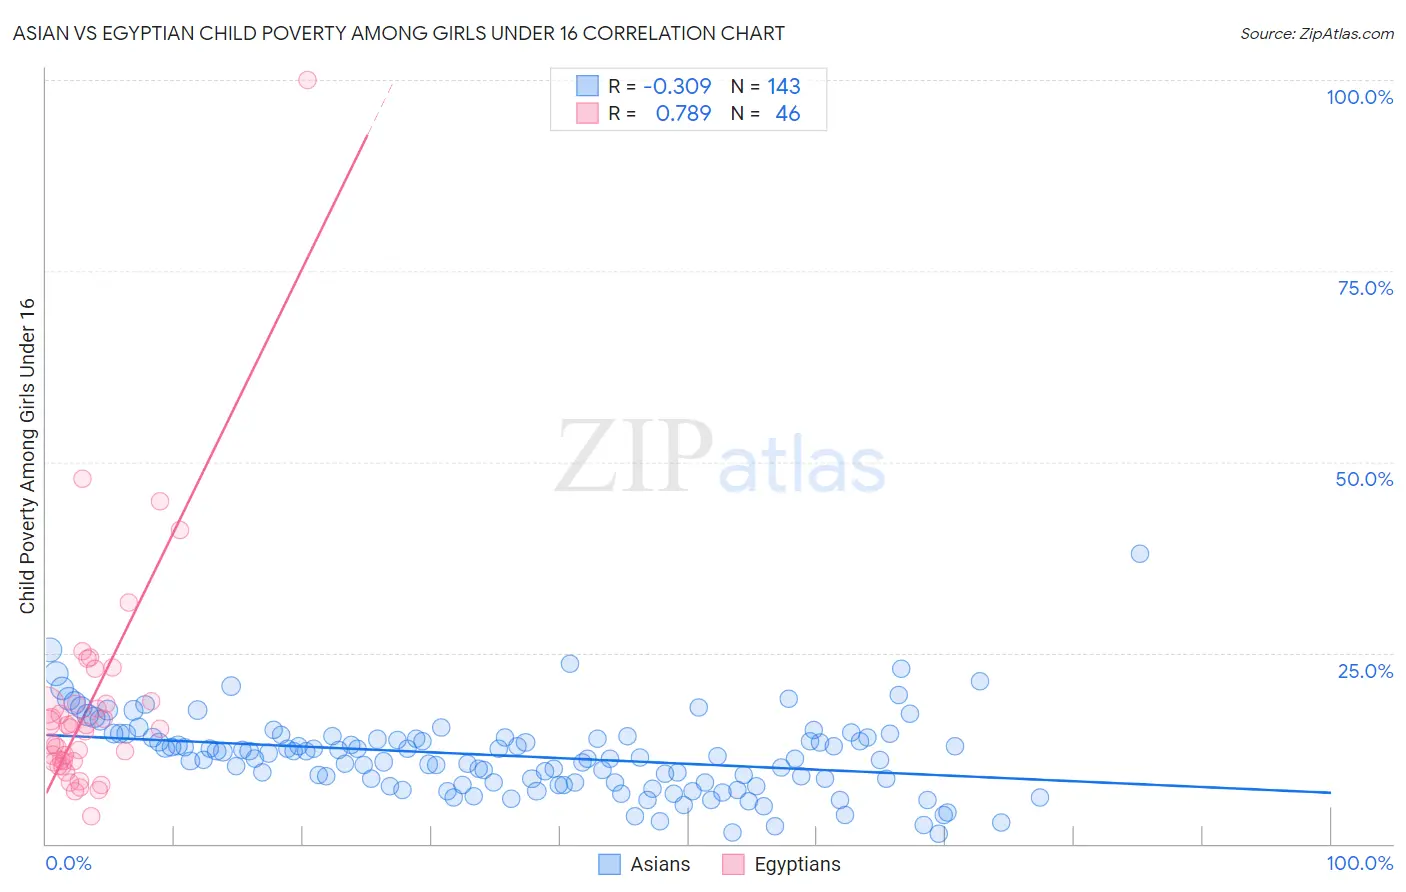
Asian vs Egyptian Child Poverty Among Girls Under 16 Correlation Chart
The statistical analysis conducted on geographies consisting of 532,137,785 people shows a mild negative correlation between the proportion of Asians and poverty level among girls under the age of 16 in the United States with a correlation coefficient (R) of -0.309 and weighted average of 13.7%. Similarly, the statistical analysis conducted on geographies consisting of 273,353,549 people shows a strong positive correlation between the proportion of Egyptians and poverty level among girls under the age of 16 in the United States with a correlation coefficient (R) of 0.789 and weighted average of 14.7%, a difference of 7.2%.
Child Poverty Among Girls Under 16 Correlation Summary
| Measurement | Asian | Egyptian |
| Minimum | 1.3% | 3.6% |
| Maximum | 38.0% | 100.0% |
| Range | 36.7% | 96.4% |
| Mean | 11.5% | 18.3% |
| Median | 11.4% | 15.2% |
| Interquartile 25% (IQ1) | 8.0% | 10.8% |
| Interquartile 75% (IQ3) | 13.9% | 18.3% |
| Interquartile Range (IQR) | 5.9% | 7.6% |
| Standard Deviation (Sample) | 5.2% | 15.5% |
| Standard Deviation (Population) | 5.2% | 15.3% |
Similar Demographics by Child Poverty Among Girls Under 16
Demographics Similar to Asians by Child Poverty Among Girls Under 16
In terms of child poverty among girls under 16, the demographic groups most similar to Asians are Turkish (13.7%, a difference of 0.12%), Danish (13.7%, a difference of 0.16%), Swedish (13.7%, a difference of 0.19%), Maltese (13.7%, a difference of 0.24%), and Bolivian (13.6%, a difference of 0.67%).
| Demographics | Rating | Rank | Child Poverty Among Girls Under 16 |
| Norwegians | 99.9 /100 | #23 | Exceptional 13.3% |
| Immigrants | Eastern Asia | 99.9 /100 | #24 | Exceptional 13.4% |
| Immigrants | China | 99.8 /100 | #25 | Exceptional 13.4% |
| Eastern Europeans | 99.8 /100 | #26 | Exceptional 13.5% |
| Latvians | 99.8 /100 | #27 | Exceptional 13.5% |
| Tongans | 99.8 /100 | #28 | Exceptional 13.6% |
| Bolivians | 99.8 /100 | #29 | Exceptional 13.6% |
| Asians | 99.7 /100 | #30 | Exceptional 13.7% |
| Turks | 99.7 /100 | #31 | Exceptional 13.7% |
| Danes | 99.7 /100 | #32 | Exceptional 13.7% |
| Swedes | 99.7 /100 | #33 | Exceptional 13.7% |
| Maltese | 99.7 /100 | #34 | Exceptional 13.7% |
| Immigrants | Northern Europe | 99.6 /100 | #35 | Exceptional 13.8% |
| Russians | 99.6 /100 | #36 | Exceptional 13.9% |
| Lithuanians | 99.6 /100 | #37 | Exceptional 13.9% |
Demographics Similar to Egyptians by Child Poverty Among Girls Under 16
In terms of child poverty among girls under 16, the demographic groups most similar to Egyptians are Immigrants from Turkey (14.7%, a difference of 0.0%), Argentinean (14.7%, a difference of 0.020%), Tlingit-Haida (14.7%, a difference of 0.030%), Immigrants from Russia (14.7%, a difference of 0.040%), and Immigrants from Eastern Europe (14.6%, a difference of 0.18%).
| Demographics | Rating | Rank | Child Poverty Among Girls Under 16 |
| Immigrants | Austria | 98.0 /100 | #73 | Exceptional 14.6% |
| Taiwanese | 98.0 /100 | #74 | Exceptional 14.6% |
| Immigrants | Eastern Europe | 98.0 /100 | #75 | Exceptional 14.6% |
| Immigrants | Russia | 97.9 /100 | #76 | Exceptional 14.7% |
| Tlingit-Haida | 97.9 /100 | #77 | Exceptional 14.7% |
| Argentineans | 97.9 /100 | #78 | Exceptional 14.7% |
| Immigrants | Turkey | 97.9 /100 | #79 | Exceptional 14.7% |
| Egyptians | 97.9 /100 | #80 | Exceptional 14.7% |
| Ukrainians | 97.7 /100 | #81 | Exceptional 14.7% |
| Macedonians | 97.6 /100 | #82 | Exceptional 14.7% |
| Immigrants | Italy | 97.4 /100 | #83 | Exceptional 14.8% |
| Soviet Union | 97.3 /100 | #84 | Exceptional 14.8% |
| Swiss | 97.2 /100 | #85 | Exceptional 14.8% |
| Australians | 97.2 /100 | #86 | Exceptional 14.8% |
| Finns | 97.2 /100 | #87 | Exceptional 14.8% |