Argentinean vs Yuman Family Poverty
COMPARE
Argentinean
Yuman
Family Poverty
Family Poverty Comparison
Argentineans
Yuman
8.4%
FAMILY POVERTY
89.6/ 100
METRIC RATING
128th/ 347
METRIC RANK
16.6%
FAMILY POVERTY
0.0/ 100
METRIC RATING
339th/ 347
METRIC RANK
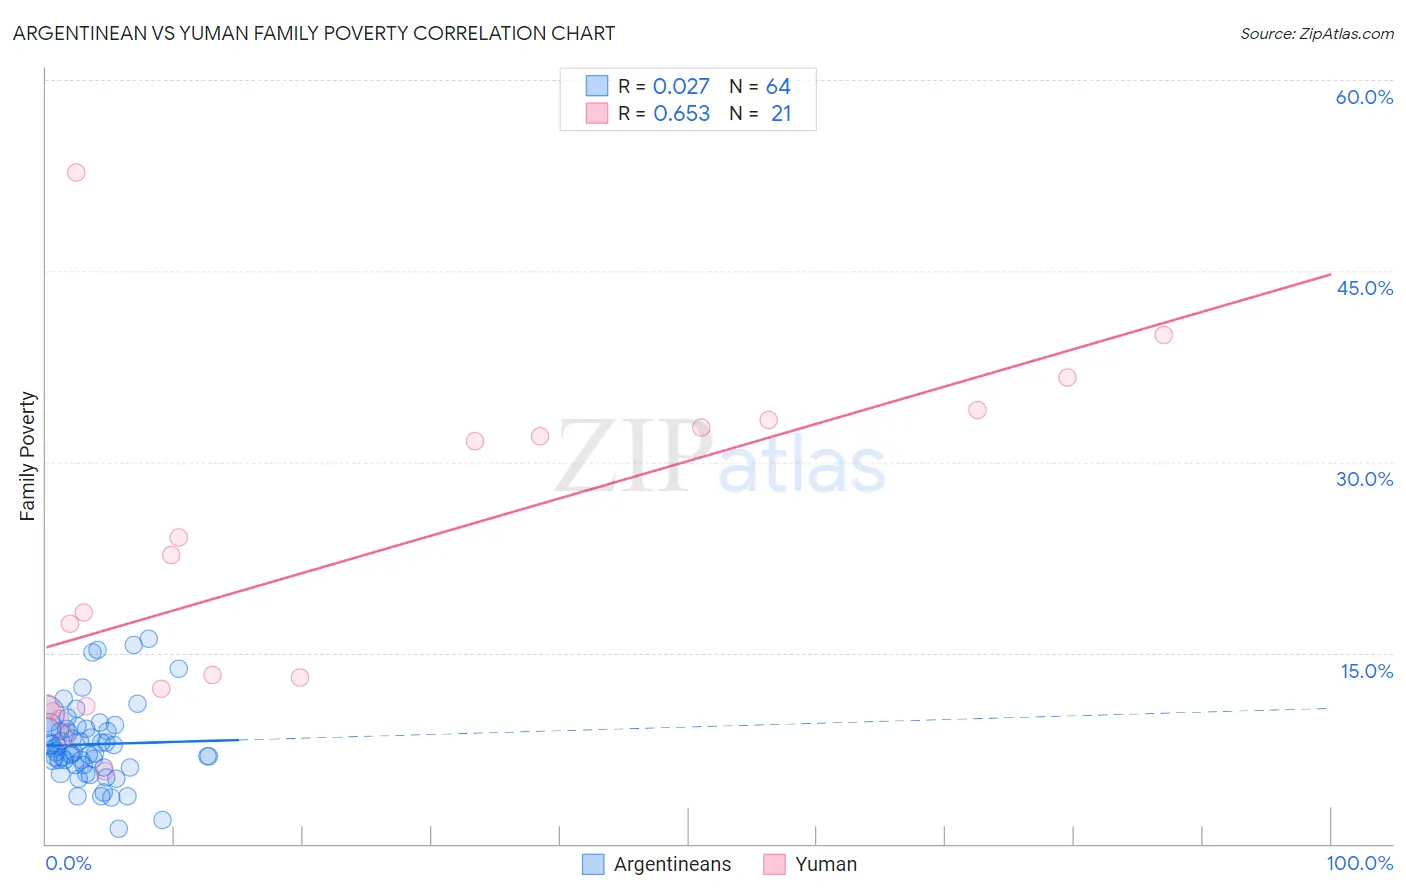
Argentinean vs Yuman Family Poverty Correlation Chart
The statistical analysis conducted on geographies consisting of 296,579,714 people shows no correlation between the proportion of Argentineans and poverty level among families in the United States with a correlation coefficient (R) of 0.027 and weighted average of 8.4%. Similarly, the statistical analysis conducted on geographies consisting of 40,648,846 people shows a significant positive correlation between the proportion of Yuman and poverty level among families in the United States with a correlation coefficient (R) of 0.653 and weighted average of 16.6%, a difference of 98.8%.
Family Poverty Correlation Summary
| Measurement | Argentinean | Yuman |
| Minimum | 1.2% | 5.7% |
| Maximum | 16.2% | 52.7% |
| Range | 14.9% | 47.0% |
| Mean | 7.8% | 22.4% |
| Median | 7.4% | 18.2% |
| Interquartile 25% (IQ1) | 6.2% | 10.8% |
| Interquartile 75% (IQ3) | 9.0% | 33.0% |
| Interquartile Range (IQR) | 2.9% | 22.2% |
| Standard Deviation (Sample) | 3.0% | 12.9% |
| Standard Deviation (Population) | 3.0% | 12.6% |
Similar Demographics by Family Poverty
Demographics Similar to Argentineans by Family Poverty
In terms of family poverty, the demographic groups most similar to Argentineans are Immigrants from Hungary (8.4%, a difference of 0.14%), Portuguese (8.4%, a difference of 0.15%), Icelander (8.3%, a difference of 0.27%), Immigrants from Bosnia and Herzegovina (8.4%, a difference of 0.34%), and Puget Sound Salish (8.4%, a difference of 0.35%).
| Demographics | Rating | Rank | Family Poverty |
| Native Hawaiians | 91.3 /100 | #121 | Exceptional 8.3% |
| Paraguayans | 91.2 /100 | #122 | Exceptional 8.3% |
| Palestinians | 91.1 /100 | #123 | Exceptional 8.3% |
| Soviet Union | 90.8 /100 | #124 | Exceptional 8.3% |
| Pakistanis | 90.8 /100 | #125 | Exceptional 8.3% |
| Icelanders | 90.3 /100 | #126 | Exceptional 8.3% |
| Immigrants | Hungary | 89.9 /100 | #127 | Excellent 8.4% |
| Argentineans | 89.6 /100 | #128 | Excellent 8.4% |
| Portuguese | 89.2 /100 | #129 | Excellent 8.4% |
| Immigrants | Bosnia and Herzegovina | 88.6 /100 | #130 | Excellent 8.4% |
| Puget Sound Salish | 88.6 /100 | #131 | Excellent 8.4% |
| Immigrants | Argentina | 88.2 /100 | #132 | Excellent 8.4% |
| Sri Lankans | 86.6 /100 | #133 | Excellent 8.5% |
| Chileans | 86.6 /100 | #134 | Excellent 8.5% |
| Immigrants | Malaysia | 86.5 /100 | #135 | Excellent 8.5% |
Demographics Similar to Yuman by Family Poverty
In terms of family poverty, the demographic groups most similar to Yuman are Pueblo (17.0%, a difference of 2.1%), Lumbee (17.0%, a difference of 2.1%), Crow (16.1%, a difference of 3.3%), Hopi (15.9%, a difference of 4.5%), and Sioux (15.9%, a difference of 5.0%).
| Demographics | Rating | Rank | Family Poverty |
| Dominicans | 0.0 /100 | #332 | Tragic 14.3% |
| Immigrants | Dominican Republic | 0.0 /100 | #333 | Tragic 14.4% |
| Houma | 0.0 /100 | #334 | Tragic 14.6% |
| Apache | 0.0 /100 | #335 | Tragic 14.7% |
| Sioux | 0.0 /100 | #336 | Tragic 15.9% |
| Hopi | 0.0 /100 | #337 | Tragic 15.9% |
| Crow | 0.0 /100 | #338 | Tragic 16.1% |
| Yuman | 0.0 /100 | #339 | Tragic 16.6% |
| Pueblo | 0.0 /100 | #340 | Tragic 17.0% |
| Lumbee | 0.0 /100 | #341 | Tragic 17.0% |
| Immigrants | Yemen | 0.0 /100 | #342 | Tragic 17.5% |
| Pima | 0.0 /100 | #343 | Tragic 18.4% |
| Yup'ik | 0.0 /100 | #344 | Tragic 18.7% |
| Navajo | 0.0 /100 | #345 | Tragic 18.8% |
| Puerto Ricans | 0.0 /100 | #346 | Tragic 20.3% |