Argentinean vs Yuman Householder Income Ages 25 - 44 years

COMPARE

Argentinean
Race
Ancestry
AfghanAfricanAlaska NativeAlaskan AthabascanAlbanianAleutAlsatianAmericanApacheArabArapahoArgentineanArmenianAssyrian/Chaldean/SyriacAustralianAustrianBahamianBangladeshiBarbadianBasqueBelgianBelizeanBermudanBhutaneseBlackfeetBolivianBrazilianBritishBritish West IndianBulgarianBurmeseCajunCambodianCanadianCape VerdeanCarpatho RusynCelticCentral AmericanCentral American IndianCherokeeCheyenneChickasawChileanChineseChippewaChoctawColombianColvilleComancheCosta RicanCreeCreekCroatianCrowCubanCypriotCzechCzechoslovakianDanishDelawareDominicanDutchDutch West IndianEastern EuropeanEcuadorianEgyptianEnglishEstonianEthiopianEuropeanFijianFilipinoFinnishFrenchFrench American IndianFrench CanadianGermanGerman RussianGhanaianGreekGuamanian/ChamorroGuatemalanGuyaneseHaitianHmongHonduranHopiHoumaHungarianIcelanderIndian (Asian)IndonesianInupiatIranianIraqiIrishIroquoisIsraeliItalianJamaicanJapaneseJordanianKenyanKiowaKoreanLaotianLatvianLebaneseLiberianLithuanianLumbeeLuxembourgerMacedonianMalaysianMalteseMarshalleseMenomineeMexicanMexican American IndianMongolianMoroccanNative HawaiianNavajoNepaleseNew ZealanderNicaraguanNigerianNorthern EuropeanNorwegianOkinawanOsageOttawaPaiutePakistaniPalestinianPanamanianParaguayanPennsylvania GermanPeruvianPimaPolishPortuguesePotawatomiPuebloPuerto RicanPuget Sound SalishRomanianRussianSalvadoranSamoanScandinavianScotch-IrishScottishSeminoleSenegaleseSerbianShoshoneSierra LeoneanSiouxSlavicSlovakSloveneSomaliSouth AfricanSouth AmericanSouth American IndianSoviet UnionSpaniardSpanishSpanish AmericanSpanish American IndianSri LankanSubsaharan AfricanSudaneseSwedishSwissSyrianTaiwaneseThaiTlingit-HaidaTohono O'OdhamTonganTrinidadian and TobagonianTsimshianTurkishU.S. Virgin IslanderUgandanUkrainianUruguayanUteVenezuelanVietnameseWelshWest IndianYakamaYaquiYugoslavianYup'ikZimbabwean
Immigration
NonimmigrantsImmigrantsAfghanistanAfricaAlbaniaArgentinaArmeniaAsiaAustraliaAustriaBahamasBangladeshBarbadosBelarusBelgiumBelizeBoliviaBosnia and HerzegovinaBrazilBulgariaBurma/MyanmarCabo VerdeCambodiaCameroonCanadaCaribbeanCentral AmericaChileChinaColombiaCongoCosta RicaCroatiaCubaCzechoslovakiaDenmarkDominicaDominican RepublicEastern AfricaEastern AsiaEastern EuropeEcuadorEgyptEl SalvadorEnglandEritreaEthiopiaEuropeFijiFranceGermanyGhanaGreeceGrenadaGuatemalaGuyanaHaitiHondurasHong KongHungaryIndiaIndonesiaIranIraqIrelandIsraelItalyJamaicaJapanJordanKazakhstanKenyaKoreaKuwaitLaosLatin AmericaLatviaLebanonLiberiaLithuaniaMalaysiaMexicoMicronesiaMiddle AfricaMoldovaMoroccoNepalNetherlandsNicaraguaNigeriaNorth AmericaNorth MacedoniaNorthern AfricaNorthern EuropeNorwayOceaniaPakistanPanamaPeruPhilippinesPolandPortugalRomaniaRussiaSaudi ArabiaScotlandSenegalSerbiaSierra LeoneSingaporeSomaliaSouth AfricaSouth AmericaSouth Central AsiaSouth Eastern AsiaSouthern EuropeSpainSri LankaSt. Vincent and the GrenadinesSudanSwedenSwitzerlandSyriaTaiwanThailandTrinidad and TobagoTurkeyUgandaUkraineUruguayUzbekistanVenezuelaVietnamWest IndiesWestern AfricaWestern AsiaWestern EuropeYemenZaireZimbabweAzores
Yuman
Race
Ancestry
AfghanAfricanAlaska NativeAlaskan AthabascanAlbanianAleutAlsatianAmericanApacheArabArapahoArmenianAssyrian/Chaldean/SyriacAustralianAustrianBahamianBangladeshiBarbadianBasqueBelgianBelizeanBermudanBhutaneseBlackfeetBolivianBrazilianBritishBritish West IndianBulgarianBurmeseCajunCambodianCanadianCape VerdeanCarpatho RusynCelticCentral AmericanCentral American IndianCherokeeCheyenneChickasawChileanChineseChippewaChoctawColombianColvilleComancheCosta RicanCreeCreekCroatianCrowCubanCypriotCzechCzechoslovakianDanishDelawareDominicanDutchDutch West IndianEastern EuropeanEcuadorianEgyptianEnglishEstonianEthiopianEuropeanFijianFilipinoFinnishFrenchFrench American IndianFrench CanadianGermanGerman RussianGhanaianGreekGuamanian/ChamorroGuatemalanGuyaneseHaitianHmongHonduranHopiHoumaHungarianIcelanderIndian (Asian)IndonesianInupiatIranianIraqiIrishIroquoisIsraeliItalianJamaicanJapaneseJordanianKenyanKiowaKoreanLaotianLatvianLebaneseLiberianLithuanianLumbeeLuxembourgerMacedonianMalaysianMalteseMarshalleseMenomineeMexicanMexican American IndianMongolianMoroccanNative HawaiianNavajoNepaleseNew ZealanderNicaraguanNigerianNorthern EuropeanNorwegianOkinawanOsageOttawaPaiutePakistaniPalestinianPanamanianParaguayanPennsylvania GermanPeruvianPimaPolishPortuguesePotawatomiPuebloPuerto RicanPuget Sound SalishRomanianRussianSalvadoranSamoanScandinavianScotch-IrishScottishSeminoleSenegaleseSerbianShoshoneSierra LeoneanSiouxSlavicSlovakSloveneSomaliSouth AfricanSouth AmericanSouth American IndianSoviet UnionSpaniardSpanishSpanish AmericanSpanish American IndianSri LankanSubsaharan AfricanSudaneseSwedishSwissSyrianTaiwaneseThaiTlingit-HaidaTohono O'OdhamTonganTrinidadian and TobagonianTsimshianTurkishU.S. Virgin IslanderUgandanUkrainianUruguayanUteVenezuelanVietnameseWelshWest IndianYakamaYaquiYugoslavianYumanYup'ikZimbabwean
Immigration
NonimmigrantsImmigrantsAfghanistanAfricaAlbaniaArgentinaArmeniaAsiaAustraliaAustriaBahamasBangladeshBarbadosBelarusBelgiumBelizeBoliviaBosnia and HerzegovinaBrazilBulgariaBurma/MyanmarCabo VerdeCambodiaCameroonCanadaCaribbeanCentral AmericaChileChinaColombiaCongoCosta RicaCroatiaCubaCzechoslovakiaDenmarkDominicaDominican RepublicEastern AfricaEastern AsiaEastern EuropeEcuadorEgyptEl SalvadorEnglandEritreaEthiopiaEuropeFijiFranceGermanyGhanaGreeceGrenadaGuatemalaGuyanaHaitiHondurasHong KongHungaryIndiaIndonesiaIranIraqIrelandIsraelItalyJamaicaJapanJordanKazakhstanKenyaKoreaKuwaitLaosLatin AmericaLatviaLebanonLiberiaLithuaniaMalaysiaMexicoMicronesiaMiddle AfricaMoldovaMoroccoNepalNetherlandsNicaraguaNigeriaNorth AmericaNorth MacedoniaNorthern AfricaNorthern EuropeNorwayOceaniaPakistanPanamaPeruPhilippinesPolandPortugalRomaniaRussiaSaudi ArabiaScotlandSenegalSerbiaSierra LeoneSingaporeSomaliaSouth AfricaSouth AmericaSouth Central AsiaSouth Eastern AsiaSouthern EuropeSpainSri LankaSt. Vincent and the GrenadinesSudanSwedenSwitzerlandSyriaTaiwanThailandTrinidad and TobagoTurkeyUgandaUkraineUruguayUzbekistanVenezuelaVietnamWest IndiesWestern AfricaWestern AsiaWestern EuropeYemenZaireZimbabweAzores
Householder Income Ages 25 - 44 years
Income
Poverty
Unemployment
Labor Participation
Family Structure
Vehicle Availability
Education Level
Disability

Householder Income Ages 25 - 44 years Comparison

Argentineans

Yuman

Exceptional
Tragic
$103,111
HOUSEHOLDER INCOME AGES 25 - 44 YEARS
99.1/ 100
METRIC RATING
83rd/ 347
METRIC RANK
$72,956
HOUSEHOLDER INCOME AGES 25 - 44 YEARS
0.0/ 100
METRIC RATING
339th/ 347
METRIC RANK

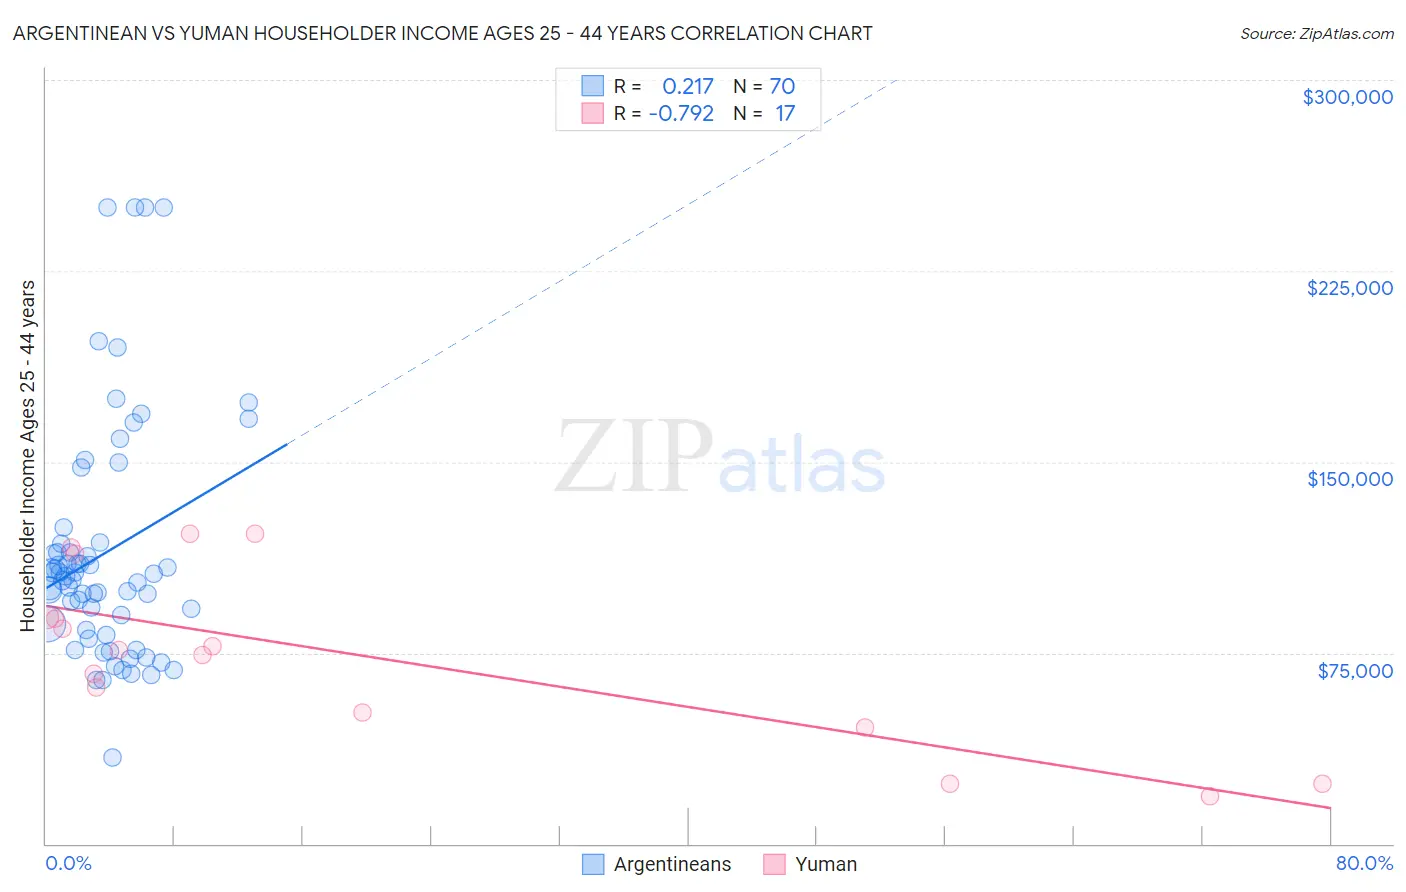
Argentinean vs Yuman Householder Income Ages 25 - 44 years Correlation Chart

The statistical analysis conducted on geographies consisting of 296,719,437 people shows a weak positive correlation between the proportion of Argentineans and household income with householder between the ages 25 and 44 in the United States with a correlation coefficient (R) of 0.217 and weighted average of $103,111. Similarly, the statistical analysis conducted on geographies consisting of 40,597,364 people shows a strong negative correlation between the proportion of Yuman and household income with householder between the ages 25 and 44 in the United States with a correlation coefficient (R) of -0.792 and weighted average of $72,956, a difference of 41.3%.
Argentinean vs Yuman Householder Income Ages 25 - 44 years

Householder Income Ages 25 - 44 years Correlation Summary

MeasurementArgentineanYuman
Minimum$33,750$18,542
Maximum$250,001$121,667
Range$216,251$103,125
Mean$114,200$73,782
Median$104,423$76,250
Interquartile 25% (IQ1)$84,111$48,591
Interquartile 75% (IQ3)$117,920$101,410
Interquartile Range (IQR)$33,809$52,819
Standard Deviation (Sample)$46,765$33,681
Standard Deviation (Population)$46,430$32,676

Similar Demographics by Householder Income Ages 25 - 44 years

Demographics Similar to Argentineans by Householder Income Ages 25 - 44 years

In terms of householder income ages 25 - 44 years, the demographic groups most similar to Argentineans are Immigrants from Serbia ($103,155, a difference of 0.040%), South African ($103,160, a difference of 0.050%), Immigrants from Egypt ($103,192, a difference of 0.080%), Armenian ($103,248, a difference of 0.13%), and Immigrants from Philippines ($102,910, a difference of 0.20%).
DemographicsRating | RankHouseholder Income Ages 25 - 44 years
Immigrants | Spain
99.4
/100
|
#76
Exceptional
$103,752
Immigrants | Southern Europe
99.3
/100
|
#77
Exceptional
$103,486
Immigrants | Bulgaria
99.3
/100
|
#78
Exceptional
$103,423
Armenians
99.2
/100
|
#79
Exceptional
$103,248
Immigrants | Egypt
99.2
/100
|
#80
Exceptional
$103,192
South Africans
99.2
/100
|
#81
Exceptional
$103,160
Immigrants | Serbia
99.2
/100
|
#82
Exceptional
$103,155
Argentineans
99.1
/100
|
#83
Exceptional
$103,111
Immigrants | Philippines
99.0
/100
|
#84
Exceptional
$102,910
Immigrants | Ukraine
98.9
/100
|
#85
Exceptional
$102,664
Immigrants | Hungary
98.9
/100
|
#86
Exceptional
$102,655
Immigrants | Western Europe
98.9
/100
|
#87
Exceptional
$102,654
Immigrants | Canada
98.9
/100
|
#88
Exceptional
$102,616
Romanians
98.8
/100
|
#89
Exceptional
$102,544
Ukrainians
98.8
/100
|
#90
Exceptional
$102,451

Demographics Similar to Yuman by Householder Income Ages 25 - 44 years

In terms of householder income ages 25 - 44 years, the demographic groups most similar to Yuman are Immigrants from Yemen ($73,043, a difference of 0.12%), Black/African American ($73,370, a difference of 0.57%), Yup'ik ($73,688, a difference of 1.0%), Immigrants from Congo ($72,178, a difference of 1.1%), and Arapaho ($71,697, a difference of 1.8%).
DemographicsRating | RankHouseholder Income Ages 25 - 44 years
Bahamians
0.0
/100
|
#332
Tragic
$75,395
Hopi
0.0
/100
|
#333
Tragic
$75,002
Creek
0.0
/100
|
#334
Tragic
$74,847
Kiowa
0.0
/100
|
#335
Tragic
$74,776
Yup'ik
0.0
/100
|
#336
Tragic
$73,688
Blacks/African Americans
0.0
/100
|
#337
Tragic
$73,370
Immigrants | Yemen
0.0
/100
|
#338
Tragic
$73,043
Yuman
0.0
/100
|
#339
Tragic
$72,956
Immigrants | Congo
0.0
/100
|
#340
Tragic
$72,178
Arapaho
0.0
/100
|
#341
Tragic
$71,697
Crow
0.0
/100
|
#342
Tragic
$71,337
Tohono O'odham
0.0
/100
|
#343
Tragic
$69,068
Pueblo
0.0
/100
|
#344
Tragic
$68,910
Navajo
0.0
/100
|
#345
Tragic
$66,529
Puerto Ricans
0.0
/100
|
#346
Tragic
$65,996