Immigrants from Sweden vs Yuman Family Poverty
COMPARE
Immigrants from Sweden
Yuman
Family Poverty
Family Poverty Comparison
Immigrants from Sweden
Yuman
7.7%
FAMILY POVERTY
98.8/ 100
METRIC RATING
54th/ 347
METRIC RANK
16.6%
FAMILY POVERTY
0.0/ 100
METRIC RATING
339th/ 347
METRIC RANK
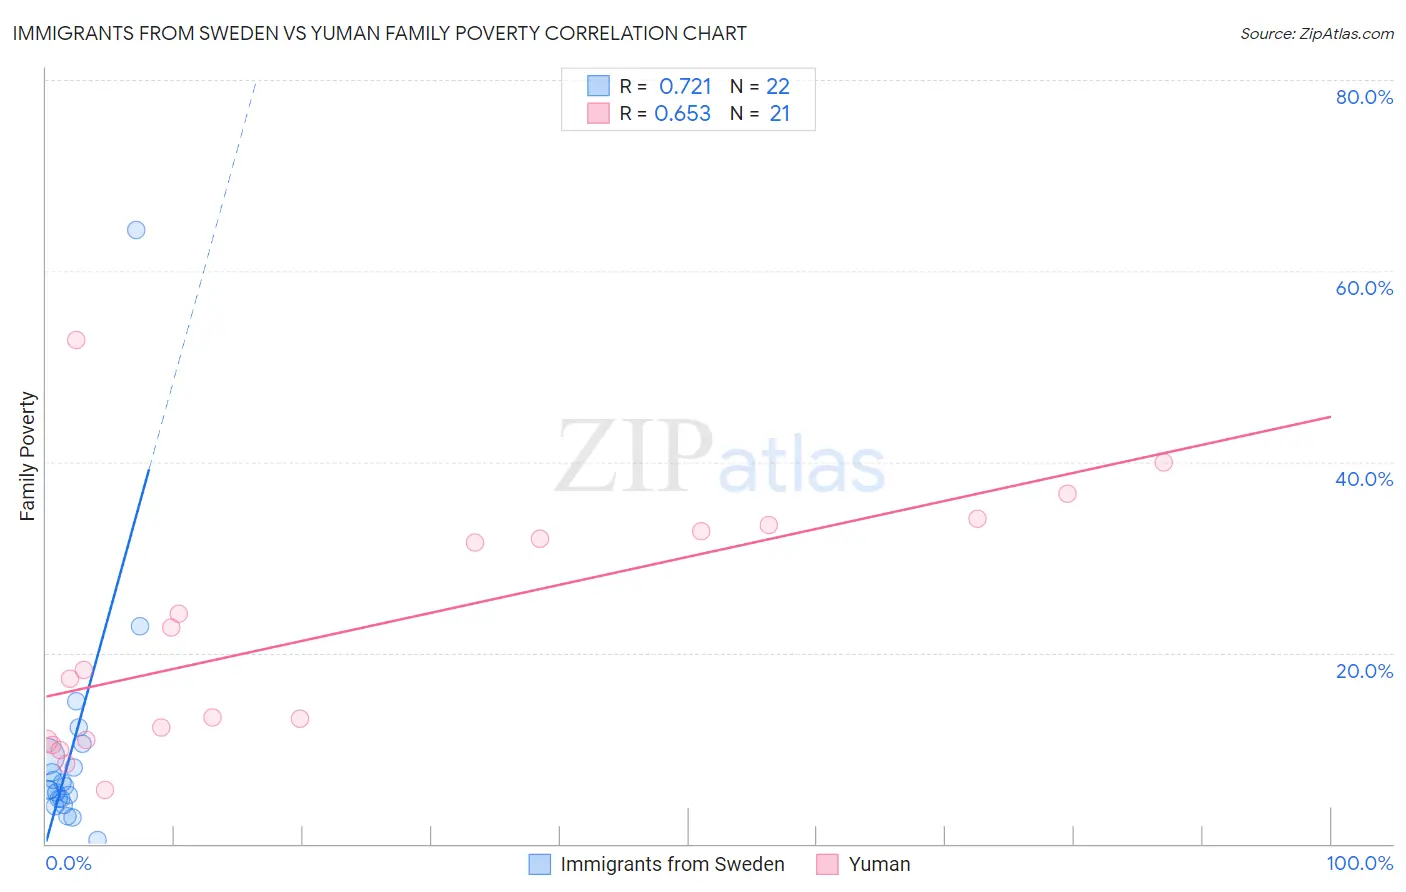
Immigrants from Sweden vs Yuman Family Poverty Correlation Chart
The statistical analysis conducted on geographies consisting of 164,497,176 people shows a strong positive correlation between the proportion of Immigrants from Sweden and poverty level among families in the United States with a correlation coefficient (R) of 0.721 and weighted average of 7.7%. Similarly, the statistical analysis conducted on geographies consisting of 40,648,846 people shows a significant positive correlation between the proportion of Yuman and poverty level among families in the United States with a correlation coefficient (R) of 0.653 and weighted average of 16.6%, a difference of 115.6%.
Family Poverty Correlation Summary
| Measurement | Immigrants from Sweden | Yuman |
| Minimum | 0.43% | 5.7% |
| Maximum | 64.3% | 52.7% |
| Range | 63.9% | 47.0% |
| Mean | 9.7% | 22.4% |
| Median | 5.8% | 18.2% |
| Interquartile 25% (IQ1) | 4.8% | 10.8% |
| Interquartile 75% (IQ3) | 9.1% | 33.0% |
| Interquartile Range (IQR) | 4.4% | 22.2% |
| Standard Deviation (Sample) | 13.1% | 12.9% |
| Standard Deviation (Population) | 12.8% | 12.6% |
Similar Demographics by Family Poverty
Demographics Similar to Immigrants from Sweden by Family Poverty
In terms of family poverty, the demographic groups most similar to Immigrants from Sweden are Swiss (7.7%, a difference of 0.010%), Immigrants from Eastern Asia (7.7%, a difference of 0.030%), Indian (Asian) (7.7%, a difference of 0.070%), Immigrants from Serbia (7.7%, a difference of 0.070%), and Asian (7.7%, a difference of 0.16%).
| Demographics | Rating | Rank | Family Poverty |
| Immigrants | Czechoslovakia | 98.9 /100 | #47 | Exceptional 7.7% |
| Immigrants | Sri Lanka | 98.9 /100 | #48 | Exceptional 7.7% |
| Immigrants | Bolivia | 98.9 /100 | #49 | Exceptional 7.7% |
| Immigrants | North Macedonia | 98.9 /100 | #50 | Exceptional 7.7% |
| Immigrants | Moldova | 98.8 /100 | #51 | Exceptional 7.7% |
| Indians (Asian) | 98.8 /100 | #52 | Exceptional 7.7% |
| Swiss | 98.8 /100 | #53 | Exceptional 7.7% |
| Immigrants | Sweden | 98.8 /100 | #54 | Exceptional 7.7% |
| Immigrants | Eastern Asia | 98.7 /100 | #55 | Exceptional 7.7% |
| Immigrants | Serbia | 98.7 /100 | #56 | Exceptional 7.7% |
| Asians | 98.7 /100 | #57 | Exceptional 7.7% |
| Finns | 98.7 /100 | #58 | Exceptional 7.7% |
| Europeans | 98.7 /100 | #59 | Exceptional 7.7% |
| Immigrants | Greece | 98.7 /100 | #60 | Exceptional 7.7% |
| Immigrants | Netherlands | 98.6 /100 | #61 | Exceptional 7.7% |
Demographics Similar to Yuman by Family Poverty
In terms of family poverty, the demographic groups most similar to Yuman are Pueblo (17.0%, a difference of 2.1%), Lumbee (17.0%, a difference of 2.1%), Crow (16.1%, a difference of 3.3%), Hopi (15.9%, a difference of 4.5%), and Sioux (15.9%, a difference of 5.0%).
| Demographics | Rating | Rank | Family Poverty |
| Dominicans | 0.0 /100 | #332 | Tragic 14.3% |
| Immigrants | Dominican Republic | 0.0 /100 | #333 | Tragic 14.4% |
| Houma | 0.0 /100 | #334 | Tragic 14.6% |
| Apache | 0.0 /100 | #335 | Tragic 14.7% |
| Sioux | 0.0 /100 | #336 | Tragic 15.9% |
| Hopi | 0.0 /100 | #337 | Tragic 15.9% |
| Crow | 0.0 /100 | #338 | Tragic 16.1% |
| Yuman | 0.0 /100 | #339 | Tragic 16.6% |
| Pueblo | 0.0 /100 | #340 | Tragic 17.0% |
| Lumbee | 0.0 /100 | #341 | Tragic 17.0% |
| Immigrants | Yemen | 0.0 /100 | #342 | Tragic 17.5% |
| Pima | 0.0 /100 | #343 | Tragic 18.4% |
| Yup'ik | 0.0 /100 | #344 | Tragic 18.7% |
| Navajo | 0.0 /100 | #345 | Tragic 18.8% |
| Puerto Ricans | 0.0 /100 | #346 | Tragic 20.3% |