Argentinean vs Alaskan Athabascan Family Poverty
COMPARE
Argentinean
Alaskan Athabascan
Family Poverty
Family Poverty Comparison
Argentineans
Alaskan Athabascans
8.4%
FAMILY POVERTY
89.6/ 100
METRIC RATING
128th/ 347
METRIC RANK
10.1%
FAMILY POVERTY
2.7/ 100
METRIC RATING
231st/ 347
METRIC RANK
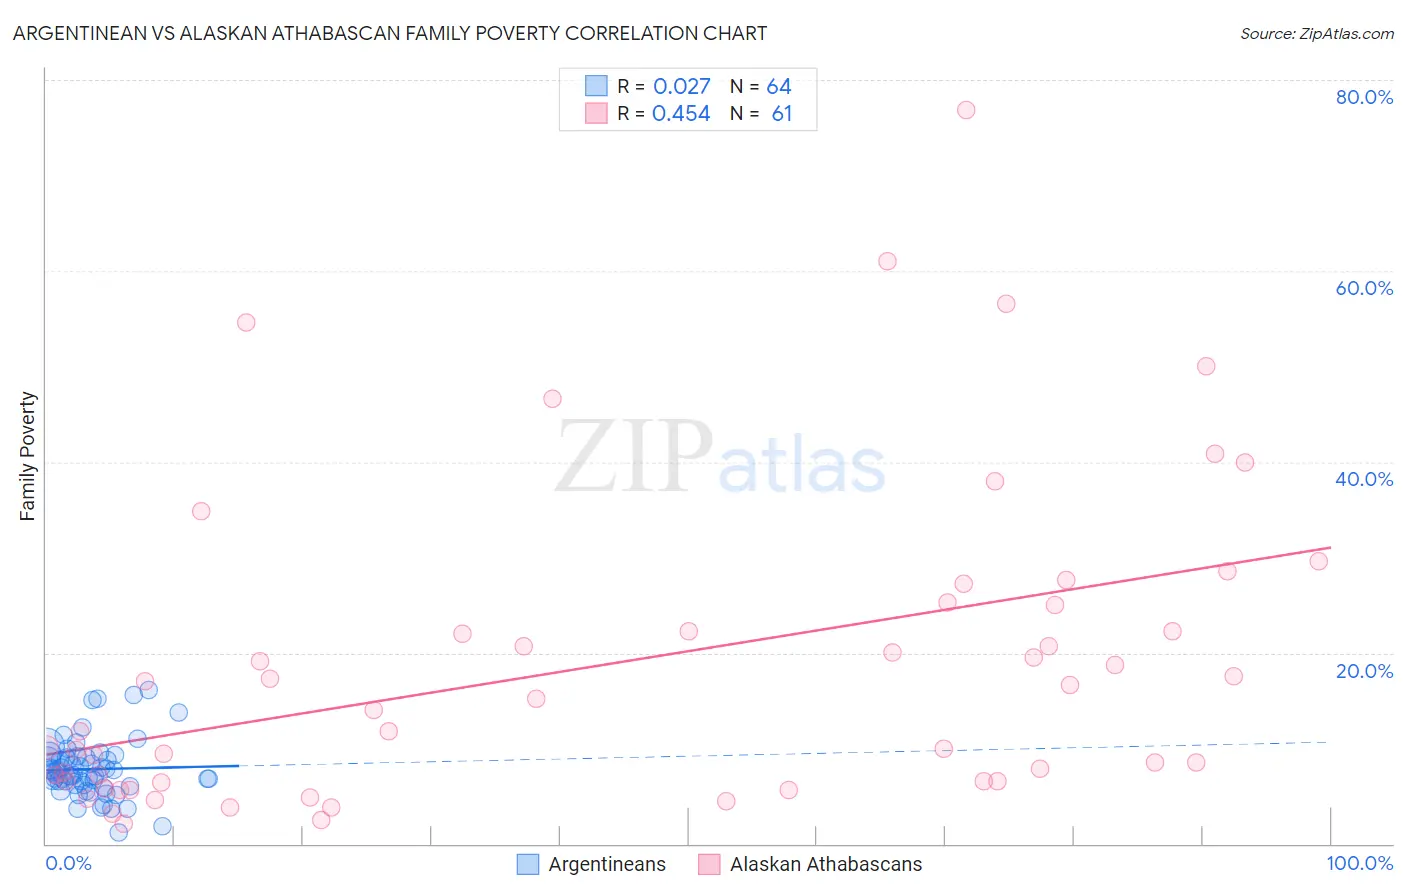
Argentinean vs Alaskan Athabascan Family Poverty Correlation Chart
The statistical analysis conducted on geographies consisting of 296,579,714 people shows no correlation between the proportion of Argentineans and poverty level among families in the United States with a correlation coefficient (R) of 0.027 and weighted average of 8.4%. Similarly, the statistical analysis conducted on geographies consisting of 45,790,128 people shows a moderate positive correlation between the proportion of Alaskan Athabascans and poverty level among families in the United States with a correlation coefficient (R) of 0.454 and weighted average of 10.1%, a difference of 20.2%.
Family Poverty Correlation Summary
| Measurement | Argentinean | Alaskan Athabascan |
| Minimum | 1.2% | 2.0% |
| Maximum | 16.2% | 76.9% |
| Range | 14.9% | 74.9% |
| Mean | 7.8% | 18.8% |
| Median | 7.4% | 14.0% |
| Interquartile 25% (IQ1) | 6.2% | 6.5% |
| Interquartile 75% (IQ3) | 9.0% | 25.1% |
| Interquartile Range (IQR) | 2.9% | 18.6% |
| Standard Deviation (Sample) | 3.0% | 16.5% |
| Standard Deviation (Population) | 3.0% | 16.3% |
Similar Demographics by Family Poverty
Demographics Similar to Argentineans by Family Poverty
In terms of family poverty, the demographic groups most similar to Argentineans are Immigrants from Hungary (8.4%, a difference of 0.14%), Portuguese (8.4%, a difference of 0.15%), Icelander (8.3%, a difference of 0.27%), Immigrants from Bosnia and Herzegovina (8.4%, a difference of 0.34%), and Puget Sound Salish (8.4%, a difference of 0.35%).
| Demographics | Rating | Rank | Family Poverty |
| Native Hawaiians | 91.3 /100 | #121 | Exceptional 8.3% |
| Paraguayans | 91.2 /100 | #122 | Exceptional 8.3% |
| Palestinians | 91.1 /100 | #123 | Exceptional 8.3% |
| Soviet Union | 90.8 /100 | #124 | Exceptional 8.3% |
| Pakistanis | 90.8 /100 | #125 | Exceptional 8.3% |
| Icelanders | 90.3 /100 | #126 | Exceptional 8.3% |
| Immigrants | Hungary | 89.9 /100 | #127 | Excellent 8.4% |
| Argentineans | 89.6 /100 | #128 | Excellent 8.4% |
| Portuguese | 89.2 /100 | #129 | Excellent 8.4% |
| Immigrants | Bosnia and Herzegovina | 88.6 /100 | #130 | Excellent 8.4% |
| Puget Sound Salish | 88.6 /100 | #131 | Excellent 8.4% |
| Immigrants | Argentina | 88.2 /100 | #132 | Excellent 8.4% |
| Sri Lankans | 86.6 /100 | #133 | Excellent 8.5% |
| Chileans | 86.6 /100 | #134 | Excellent 8.5% |
| Immigrants | Malaysia | 86.5 /100 | #135 | Excellent 8.5% |
Demographics Similar to Alaskan Athabascans by Family Poverty
In terms of family poverty, the demographic groups most similar to Alaskan Athabascans are Immigrants from Panama (10.0%, a difference of 0.38%), Immigrants from Uzbekistan (10.0%, a difference of 0.40%), Sudanese (10.0%, a difference of 0.41%), Immigrants from Sudan (10.1%, a difference of 0.43%), and Immigrants from Armenia (10.0%, a difference of 0.62%).
| Demographics | Rating | Rank | Family Poverty |
| Marshallese | 3.9 /100 | #224 | Tragic 9.9% |
| Immigrants | Immigrants | 3.6 /100 | #225 | Tragic 10.0% |
| Ottawa | 3.3 /100 | #226 | Tragic 10.0% |
| Immigrants | Armenia | 3.3 /100 | #227 | Tragic 10.0% |
| Sudanese | 3.1 /100 | #228 | Tragic 10.0% |
| Immigrants | Uzbekistan | 3.1 /100 | #229 | Tragic 10.0% |
| Immigrants | Panama | 3.1 /100 | #230 | Tragic 10.0% |
| Alaskan Athabascans | 2.7 /100 | #231 | Tragic 10.1% |
| Immigrants | Sudan | 2.3 /100 | #232 | Tragic 10.1% |
| Fijians | 2.1 /100 | #233 | Tragic 10.1% |
| Immigrants | Middle Africa | 2.1 /100 | #234 | Tragic 10.1% |
| Nigerians | 2.0 /100 | #235 | Tragic 10.1% |
| Immigrants | Nigeria | 1.9 /100 | #236 | Tragic 10.2% |
| Immigrants | Laos | 1.7 /100 | #237 | Tragic 10.2% |
| French American Indians | 1.5 /100 | #238 | Tragic 10.2% |