Argentinean vs Immigrants from Sierra Leone Single Mother Poverty
COMPARE
Argentinean
Immigrants from Sierra Leone
Single Mother Poverty
Single Mother Poverty Comparison
Argentineans
Immigrants from Sierra Leone
27.2%
SINGLE MOTHER POVERTY
99.6/ 100
METRIC RATING
58th/ 347
METRIC RANK
26.9%
SINGLE MOTHER POVERTY
99.9/ 100
METRIC RATING
44th/ 347
METRIC RANK
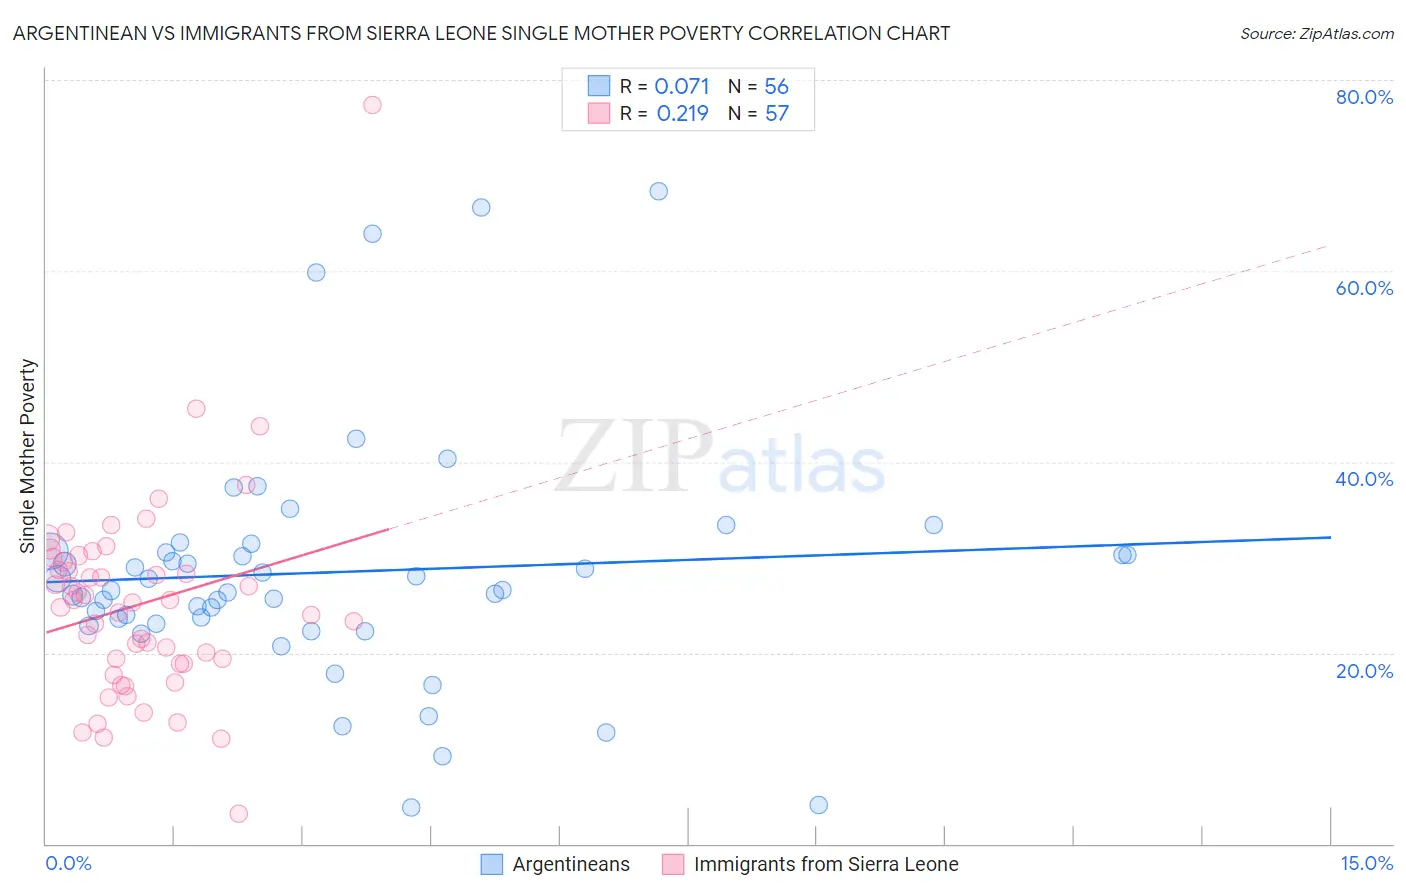
Argentinean vs Immigrants from Sierra Leone Single Mother Poverty Correlation Chart
The statistical analysis conducted on geographies consisting of 291,528,298 people shows a slight positive correlation between the proportion of Argentineans and poverty level among single mothers in the United States with a correlation coefficient (R) of 0.071 and weighted average of 27.2%. Similarly, the statistical analysis conducted on geographies consisting of 101,102,212 people shows a weak positive correlation between the proportion of Immigrants from Sierra Leone and poverty level among single mothers in the United States with a correlation coefficient (R) of 0.219 and weighted average of 26.9%, a difference of 1.3%.
Single Mother Poverty Correlation Summary
| Measurement | Argentinean | Immigrants from Sierra Leone |
| Minimum | 3.7% | 3.1% |
| Maximum | 68.3% | 77.3% |
| Range | 64.6% | 74.2% |
| Mean | 28.4% | 25.1% |
| Median | 26.5% | 25.2% |
| Interquartile 25% (IQ1) | 23.3% | 18.9% |
| Interquartile 75% (IQ3) | 30.6% | 29.7% |
| Interquartile Range (IQR) | 7.3% | 10.9% |
| Standard Deviation (Sample) | 12.7% | 10.8% |
| Standard Deviation (Population) | 12.6% | 10.7% |
Demographics Similar to Argentineans and Immigrants from Sierra Leone by Single Mother Poverty
In terms of single mother poverty, the demographic groups most similar to Argentineans are Paraguayan (27.2%, a difference of 0.010%), Eastern European (27.2%, a difference of 0.050%), Palestinian (27.2%, a difference of 0.15%), Immigrants from Eastern Europe (27.2%, a difference of 0.16%), and Immigrants from Romania (27.2%, a difference of 0.18%). Similarly, the demographic groups most similar to Immigrants from Sierra Leone are Latvian (26.9%, a difference of 0.070%), Immigrants from Serbia (26.9%, a difference of 0.12%), Tsimshian (26.8%, a difference of 0.14%), Egyptian (26.9%, a difference of 0.18%), and Armenian (26.8%, a difference of 0.22%).
| Demographics | Rating | Rank | Single Mother Poverty |
| Immigrants | Greece | 99.9 /100 | #41 | Exceptional 26.7% |
| Armenians | 99.9 /100 | #42 | Exceptional 26.8% |
| Tsimshian | 99.9 /100 | #43 | Exceptional 26.8% |
| Immigrants | Sierra Leone | 99.9 /100 | #44 | Exceptional 26.9% |
| Latvians | 99.9 /100 | #45 | Exceptional 26.9% |
| Immigrants | Serbia | 99.9 /100 | #46 | Exceptional 26.9% |
| Egyptians | 99.8 /100 | #47 | Exceptional 26.9% |
| Immigrants | Poland | 99.8 /100 | #48 | Exceptional 26.9% |
| Cambodians | 99.8 /100 | #49 | Exceptional 27.0% |
| Laotians | 99.8 /100 | #50 | Exceptional 27.0% |
| Immigrants | Argentina | 99.7 /100 | #51 | Exceptional 27.1% |
| Immigrants | South Eastern Asia | 99.7 /100 | #52 | Exceptional 27.1% |
| Immigrants | Jordan | 99.7 /100 | #53 | Exceptional 27.1% |
| Immigrants | Bulgaria | 99.7 /100 | #54 | Exceptional 27.1% |
| Immigrants | Egypt | 99.7 /100 | #55 | Exceptional 27.1% |
| Immigrants | Romania | 99.7 /100 | #56 | Exceptional 27.2% |
| Palestinians | 99.7 /100 | #57 | Exceptional 27.2% |
| Argentineans | 99.6 /100 | #58 | Exceptional 27.2% |
| Paraguayans | 99.6 /100 | #59 | Exceptional 27.2% |
| Eastern Europeans | 99.6 /100 | #60 | Exceptional 27.2% |
| Immigrants | Eastern Europe | 99.6 /100 | #61 | Exceptional 27.2% |