Slovene vs Immigrants from Sierra Leone Single Mother Poverty
COMPARE
Slovene
Immigrants from Sierra Leone
Single Mother Poverty
Single Mother Poverty Comparison
Slovenes
Immigrants from Sierra Leone
28.8%
SINGLE MOTHER POVERTY
76.4/ 100
METRIC RATING
153rd/ 347
METRIC RANK
26.9%
SINGLE MOTHER POVERTY
99.9/ 100
METRIC RATING
44th/ 347
METRIC RANK
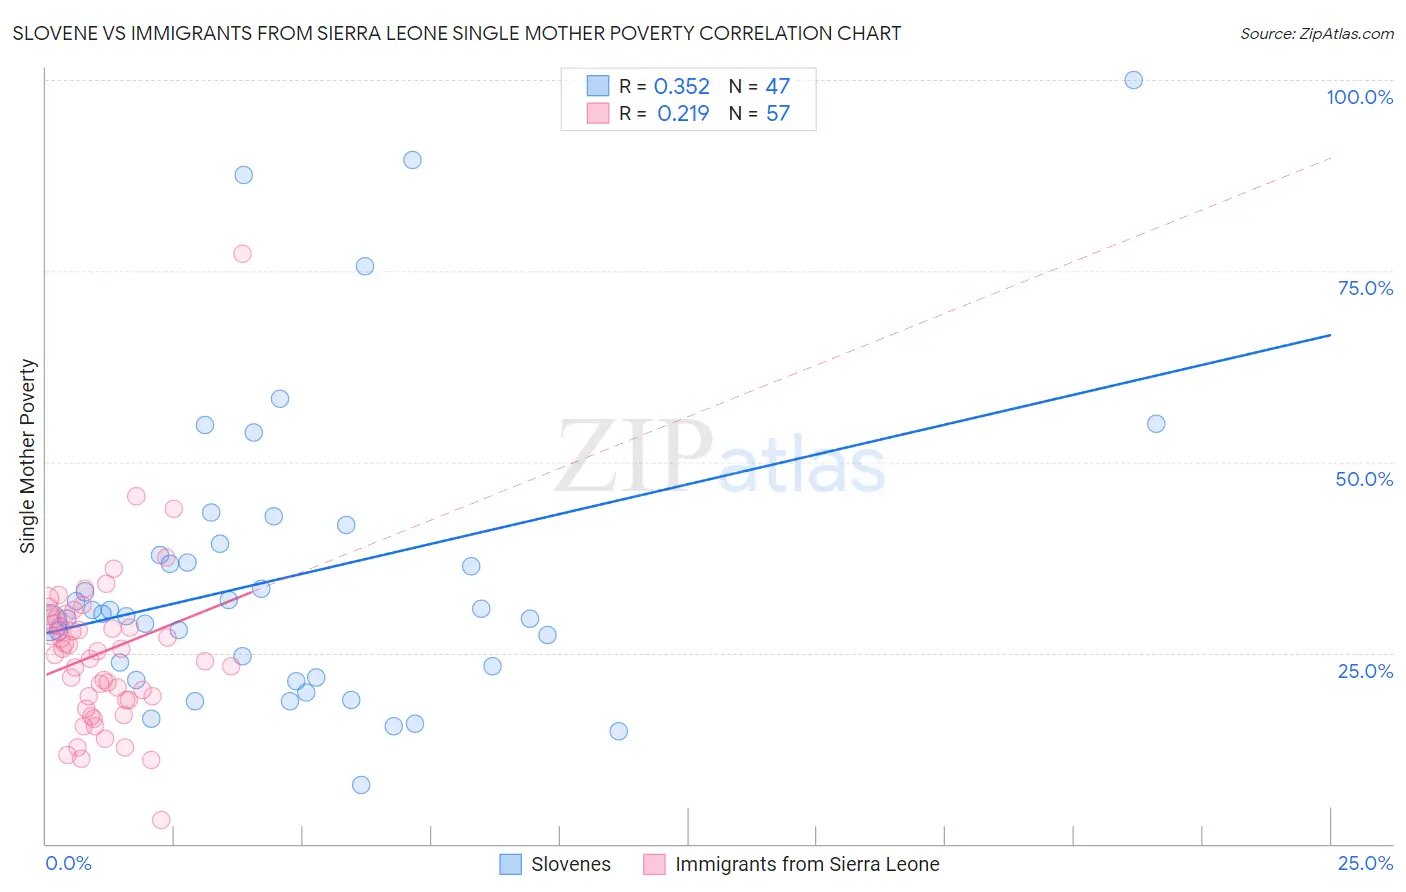
Slovene vs Immigrants from Sierra Leone Single Mother Poverty Correlation Chart
The statistical analysis conducted on geographies consisting of 255,975,131 people shows a mild positive correlation between the proportion of Slovenes and poverty level among single mothers in the United States with a correlation coefficient (R) of 0.352 and weighted average of 28.8%. Similarly, the statistical analysis conducted on geographies consisting of 101,102,212 people shows a weak positive correlation between the proportion of Immigrants from Sierra Leone and poverty level among single mothers in the United States with a correlation coefficient (R) of 0.219 and weighted average of 26.9%, a difference of 7.0%.
Single Mother Poverty Correlation Summary
| Measurement | Slovene | Immigrants from Sierra Leone |
| Minimum | 7.7% | 3.1% |
| Maximum | 100.0% | 77.3% |
| Range | 92.3% | 74.2% |
| Mean | 35.2% | 25.1% |
| Median | 30.1% | 25.2% |
| Interquartile 25% (IQ1) | 21.7% | 18.9% |
| Interquartile 75% (IQ3) | 39.2% | 29.7% |
| Interquartile Range (IQR) | 17.5% | 10.9% |
| Standard Deviation (Sample) | 19.9% | 10.8% |
| Standard Deviation (Population) | 19.6% | 10.7% |
Similar Demographics by Single Mother Poverty
Demographics Similar to Slovenes by Single Mother Poverty
In terms of single mother poverty, the demographic groups most similar to Slovenes are Austrian (28.7%, a difference of 0.18%), Portuguese (28.8%, a difference of 0.21%), Immigrants from Oceania (28.7%, a difference of 0.25%), Ugandan (28.8%, a difference of 0.29%), and Iraqi (28.8%, a difference of 0.31%).
| Demographics | Rating | Rank | Single Mother Poverty |
| Immigrants | Denmark | 86.1 /100 | #146 | Excellent 28.5% |
| Immigrants | Lebanon | 85.3 /100 | #147 | Excellent 28.6% |
| Syrians | 85.3 /100 | #148 | Excellent 28.6% |
| Serbians | 85.0 /100 | #149 | Excellent 28.6% |
| Northern Europeans | 81.7 /100 | #150 | Excellent 28.6% |
| Immigrants | Oceania | 79.9 /100 | #151 | Good 28.7% |
| Austrians | 79.0 /100 | #152 | Good 28.7% |
| Slovenes | 76.4 /100 | #153 | Good 28.8% |
| Portuguese | 73.2 /100 | #154 | Good 28.8% |
| Ugandans | 71.7 /100 | #155 | Good 28.8% |
| Iraqis | 71.5 /100 | #156 | Good 28.8% |
| Immigrants | Western Europe | 71.1 /100 | #157 | Good 28.9% |
| Immigrants | Hungary | 70.6 /100 | #158 | Good 28.9% |
| Czechs | 68.4 /100 | #159 | Good 28.9% |
| Japanese | 68.0 /100 | #160 | Good 28.9% |
Demographics Similar to Immigrants from Sierra Leone by Single Mother Poverty
In terms of single mother poverty, the demographic groups most similar to Immigrants from Sierra Leone are Latvian (26.9%, a difference of 0.070%), Immigrants from Serbia (26.9%, a difference of 0.12%), Tsimshian (26.8%, a difference of 0.14%), Egyptian (26.9%, a difference of 0.18%), and Armenian (26.8%, a difference of 0.22%).
| Demographics | Rating | Rank | Single Mother Poverty |
| Immigrants | Israel | 99.9 /100 | #37 | Exceptional 26.6% |
| Immigrants | Fiji | 99.9 /100 | #38 | Exceptional 26.6% |
| Sri Lankans | 99.9 /100 | #39 | Exceptional 26.7% |
| Immigrants | Vietnam | 99.9 /100 | #40 | Exceptional 26.7% |
| Immigrants | Greece | 99.9 /100 | #41 | Exceptional 26.7% |
| Armenians | 99.9 /100 | #42 | Exceptional 26.8% |
| Tsimshian | 99.9 /100 | #43 | Exceptional 26.8% |
| Immigrants | Sierra Leone | 99.9 /100 | #44 | Exceptional 26.9% |
| Latvians | 99.9 /100 | #45 | Exceptional 26.9% |
| Immigrants | Serbia | 99.9 /100 | #46 | Exceptional 26.9% |
| Egyptians | 99.8 /100 | #47 | Exceptional 26.9% |
| Immigrants | Poland | 99.8 /100 | #48 | Exceptional 26.9% |
| Cambodians | 99.8 /100 | #49 | Exceptional 27.0% |
| Laotians | 99.8 /100 | #50 | Exceptional 27.0% |
| Immigrants | Argentina | 99.7 /100 | #51 | Exceptional 27.1% |