Czechoslovakian vs Immigrants from Sierra Leone Single Mother Poverty
COMPARE
Czechoslovakian
Immigrants from Sierra Leone
Single Mother Poverty
Single Mother Poverty Comparison
Czechoslovakians
Immigrants from Sierra Leone
29.7%
SINGLE MOTHER POVERTY
16.1/ 100
METRIC RATING
205th/ 347
METRIC RANK
26.9%
SINGLE MOTHER POVERTY
99.9/ 100
METRIC RATING
44th/ 347
METRIC RANK
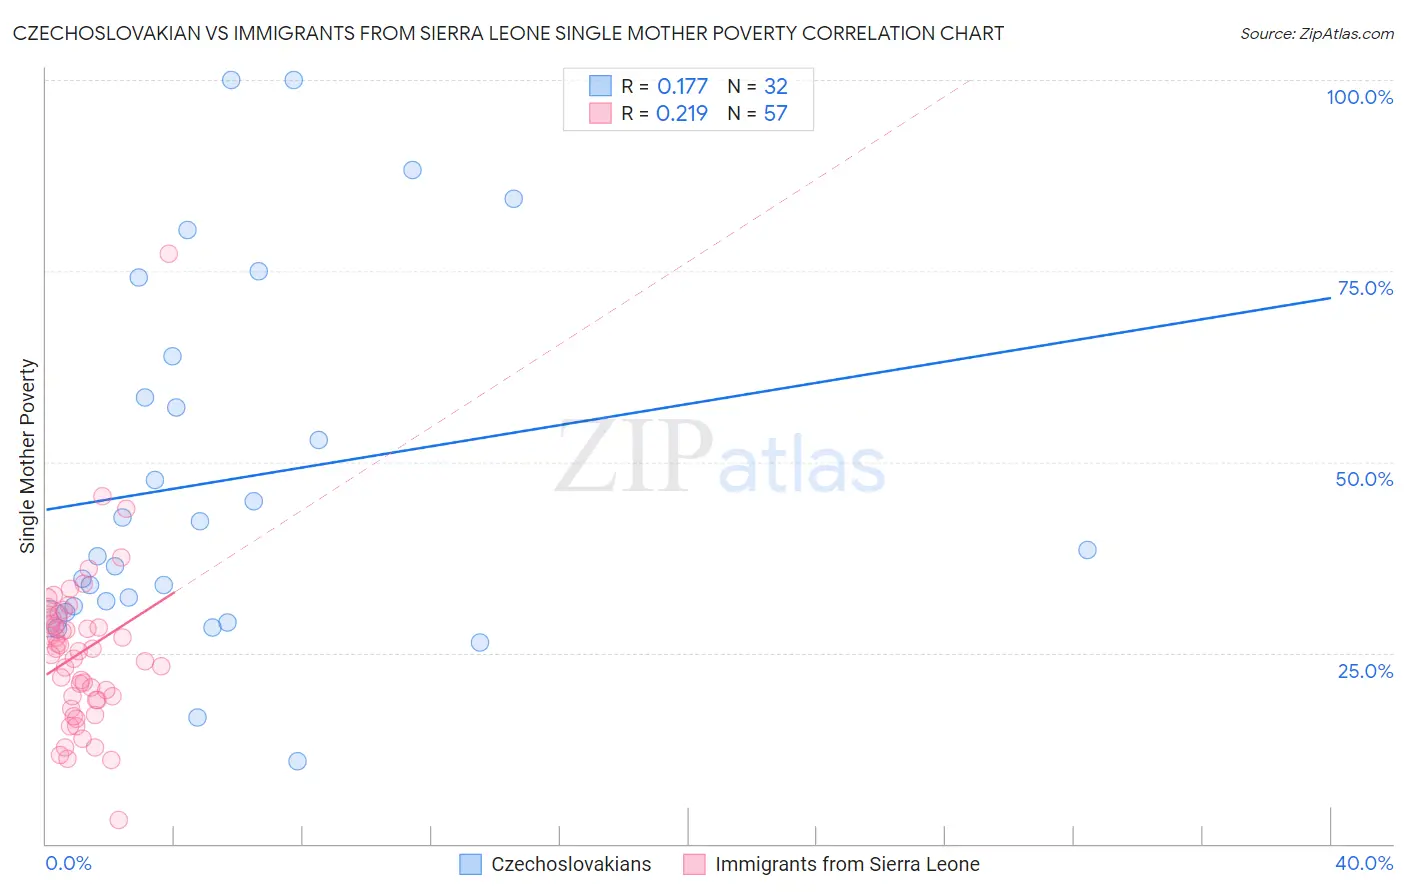
Czechoslovakian vs Immigrants from Sierra Leone Single Mother Poverty Correlation Chart
The statistical analysis conducted on geographies consisting of 358,570,470 people shows a poor positive correlation between the proportion of Czechoslovakians and poverty level among single mothers in the United States with a correlation coefficient (R) of 0.177 and weighted average of 29.7%. Similarly, the statistical analysis conducted on geographies consisting of 101,102,212 people shows a weak positive correlation between the proportion of Immigrants from Sierra Leone and poverty level among single mothers in the United States with a correlation coefficient (R) of 0.219 and weighted average of 26.9%, a difference of 10.7%.
Single Mother Poverty Correlation Summary
| Measurement | Czechoslovakian | Immigrants from Sierra Leone |
| Minimum | 10.8% | 3.1% |
| Maximum | 100.0% | 77.3% |
| Range | 89.2% | 74.2% |
| Mean | 47.5% | 25.1% |
| Median | 38.1% | 25.2% |
| Interquartile 25% (IQ1) | 30.7% | 18.9% |
| Interquartile 75% (IQ3) | 61.2% | 29.7% |
| Interquartile Range (IQR) | 30.4% | 10.9% |
| Standard Deviation (Sample) | 23.9% | 10.8% |
| Standard Deviation (Population) | 23.5% | 10.7% |
Similar Demographics by Single Mother Poverty
Demographics Similar to Czechoslovakians by Single Mother Poverty
In terms of single mother poverty, the demographic groups most similar to Czechoslovakians are Immigrants from Haiti (29.7%, a difference of 0.020%), Immigrants (29.7%, a difference of 0.040%), Immigrants from Panama (29.8%, a difference of 0.050%), Swiss (29.7%, a difference of 0.10%), and Malaysian (29.7%, a difference of 0.11%).
| Demographics | Rating | Rank | Single Mother Poverty |
| Trinidadians and Tobagonians | 21.7 /100 | #198 | Fair 29.6% |
| Cubans | 20.8 /100 | #199 | Fair 29.6% |
| Panamanians | 20.0 /100 | #200 | Fair 29.6% |
| Belgians | 18.8 /100 | #201 | Poor 29.7% |
| Malaysians | 17.4 /100 | #202 | Poor 29.7% |
| Swiss | 17.2 /100 | #203 | Poor 29.7% |
| Immigrants | Immigrants | 16.6 /100 | #204 | Poor 29.7% |
| Czechoslovakians | 16.1 /100 | #205 | Poor 29.7% |
| Immigrants | Haiti | 15.8 /100 | #206 | Poor 29.7% |
| Immigrants | Panama | 15.5 /100 | #207 | Poor 29.8% |
| Immigrants | Guyana | 14.7 /100 | #208 | Poor 29.8% |
| Irish | 13.9 /100 | #209 | Poor 29.8% |
| Haitians | 13.3 /100 | #210 | Poor 29.8% |
| Guyanese | 12.8 /100 | #211 | Poor 29.8% |
| Nicaraguans | 12.4 /100 | #212 | Poor 29.8% |
Demographics Similar to Immigrants from Sierra Leone by Single Mother Poverty
In terms of single mother poverty, the demographic groups most similar to Immigrants from Sierra Leone are Latvian (26.9%, a difference of 0.070%), Immigrants from Serbia (26.9%, a difference of 0.12%), Tsimshian (26.8%, a difference of 0.14%), Egyptian (26.9%, a difference of 0.18%), and Armenian (26.8%, a difference of 0.22%).
| Demographics | Rating | Rank | Single Mother Poverty |
| Immigrants | Israel | 99.9 /100 | #37 | Exceptional 26.6% |
| Immigrants | Fiji | 99.9 /100 | #38 | Exceptional 26.6% |
| Sri Lankans | 99.9 /100 | #39 | Exceptional 26.7% |
| Immigrants | Vietnam | 99.9 /100 | #40 | Exceptional 26.7% |
| Immigrants | Greece | 99.9 /100 | #41 | Exceptional 26.7% |
| Armenians | 99.9 /100 | #42 | Exceptional 26.8% |
| Tsimshian | 99.9 /100 | #43 | Exceptional 26.8% |
| Immigrants | Sierra Leone | 99.9 /100 | #44 | Exceptional 26.9% |
| Latvians | 99.9 /100 | #45 | Exceptional 26.9% |
| Immigrants | Serbia | 99.9 /100 | #46 | Exceptional 26.9% |
| Egyptians | 99.8 /100 | #47 | Exceptional 26.9% |
| Immigrants | Poland | 99.8 /100 | #48 | Exceptional 26.9% |
| Cambodians | 99.8 /100 | #49 | Exceptional 27.0% |
| Laotians | 99.8 /100 | #50 | Exceptional 27.0% |
| Immigrants | Argentina | 99.7 /100 | #51 | Exceptional 27.1% |