American vs Cypriot Single Mother Poverty
COMPARE
American
Cypriot
Single Mother Poverty
Single Mother Poverty Comparison
Americans
Cypriots
33.5%
SINGLE MOTHER POVERTY
0.0/ 100
METRIC RATING
303rd/ 347
METRIC RANK
28.3%
SINGLE MOTHER POVERTY
92.3/ 100
METRIC RATING
120th/ 347
METRIC RANK
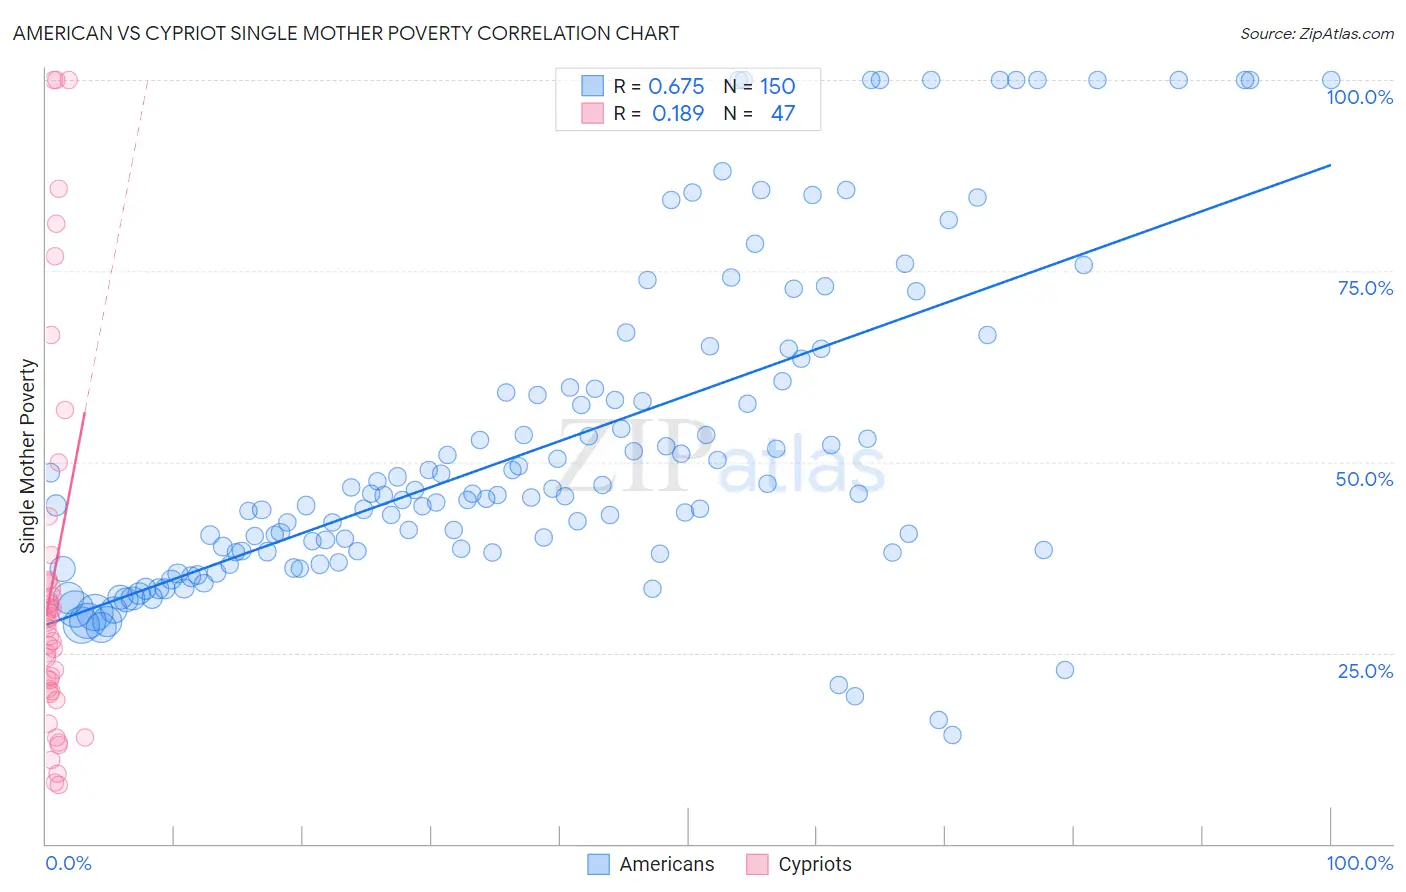
American vs Cypriot Single Mother Poverty Correlation Chart
The statistical analysis conducted on geographies consisting of 551,658,648 people shows a significant positive correlation between the proportion of Americans and poverty level among single mothers in the United States with a correlation coefficient (R) of 0.675 and weighted average of 33.5%. Similarly, the statistical analysis conducted on geographies consisting of 61,106,831 people shows a poor positive correlation between the proportion of Cypriots and poverty level among single mothers in the United States with a correlation coefficient (R) of 0.189 and weighted average of 28.3%, a difference of 18.4%.
Single Mother Poverty Correlation Summary
| Measurement | American | Cypriot |
| Minimum | 14.3% | 7.7% |
| Maximum | 100.0% | 100.0% |
| Range | 85.7% | 92.3% |
| Mean | 51.9% | 34.7% |
| Median | 45.5% | 28.2% |
| Interquartile 25% (IQ1) | 38.2% | 20.0% |
| Interquartile 75% (IQ3) | 59.6% | 34.6% |
| Interquartile Range (IQR) | 21.5% | 14.7% |
| Standard Deviation (Sample) | 21.0% | 24.8% |
| Standard Deviation (Population) | 20.9% | 24.5% |
Similar Demographics by Single Mother Poverty
Demographics Similar to Americans by Single Mother Poverty
In terms of single mother poverty, the demographic groups most similar to Americans are Mexican (33.6%, a difference of 0.10%), Immigrants from Central America (33.6%, a difference of 0.15%), Arapaho (33.4%, a difference of 0.26%), Immigrants from Somalia (33.4%, a difference of 0.41%), and Immigrants from Guatemala (33.3%, a difference of 0.65%).
| Demographics | Rating | Rank | Single Mother Poverty |
| Blackfeet | 0.0 /100 | #296 | Tragic 33.2% |
| Pennsylvania Germans | 0.0 /100 | #297 | Tragic 33.2% |
| Africans | 0.0 /100 | #298 | Tragic 33.3% |
| Immigrants | Guatemala | 0.0 /100 | #299 | Tragic 33.3% |
| Hispanics or Latinos | 0.0 /100 | #300 | Tragic 33.3% |
| Immigrants | Somalia | 0.0 /100 | #301 | Tragic 33.4% |
| Arapaho | 0.0 /100 | #302 | Tragic 33.4% |
| Americans | 0.0 /100 | #303 | Tragic 33.5% |
| Mexicans | 0.0 /100 | #304 | Tragic 33.6% |
| Immigrants | Central America | 0.0 /100 | #305 | Tragic 33.6% |
| Immigrants | Congo | 0.0 /100 | #306 | Tragic 33.8% |
| Comanche | 0.0 /100 | #307 | Tragic 33.9% |
| Immigrants | Mexico | 0.0 /100 | #308 | Tragic 34.0% |
| Potawatomi | 0.0 /100 | #309 | Tragic 34.1% |
| Hondurans | 0.0 /100 | #310 | Tragic 34.2% |
Demographics Similar to Cypriots by Single Mother Poverty
In terms of single mother poverty, the demographic groups most similar to Cypriots are Immigrants from Syria (28.3%, a difference of 0.020%), Brazilian (28.3%, a difference of 0.030%), Australian (28.3%, a difference of 0.040%), Immigrants from Afghanistan (28.3%, a difference of 0.040%), and Immigrants from Uganda (28.3%, a difference of 0.050%).
| Demographics | Rating | Rank | Single Mother Poverty |
| Immigrants | South Africa | 93.2 /100 | #113 | Exceptional 28.3% |
| Immigrants | Western Asia | 92.7 /100 | #114 | Exceptional 28.3% |
| Immigrants | Kuwait | 92.7 /100 | #115 | Exceptional 28.3% |
| Immigrants | Uganda | 92.5 /100 | #116 | Exceptional 28.3% |
| Australians | 92.5 /100 | #117 | Exceptional 28.3% |
| Brazilians | 92.4 /100 | #118 | Exceptional 28.3% |
| Immigrants | Syria | 92.4 /100 | #119 | Exceptional 28.3% |
| Cypriots | 92.3 /100 | #120 | Exceptional 28.3% |
| Immigrants | Afghanistan | 92.1 /100 | #121 | Exceptional 28.3% |
| Colombians | 91.8 /100 | #122 | Exceptional 28.3% |
| Uruguayans | 91.7 /100 | #123 | Exceptional 28.3% |
| Immigrants | Switzerland | 91.7 /100 | #124 | Exceptional 28.3% |
| Kenyans | 90.9 /100 | #125 | Exceptional 28.4% |
| Immigrants | Chile | 90.8 /100 | #126 | Exceptional 28.4% |
| Poles | 90.8 /100 | #127 | Exceptional 28.4% |